_(%25)_RYB2016.png)
 (%) RYB2016.png&body=Statistics Explained - Employment rates by migration status, persons aged 20–64, top 20 NUTS 2 regions with the highest employment rates for migrants, 2014 (¹) (%) RYB2016.png %0A https%3A%2F%2Fec.europa.eu%2Feurostat%2Fstatistics-explained%2Findex.php%3Ftitle%3DFile%3AEmployment_rates_by_migration_status%2C_persons_aged_20%25E2%2580%259364%2C_top_20_NUTS_2_regions_with_the_highest_employment_rates_for_migrants%2C_2014_%28%25C2%25B9%29_%28%2525%29_RYB2016.png)
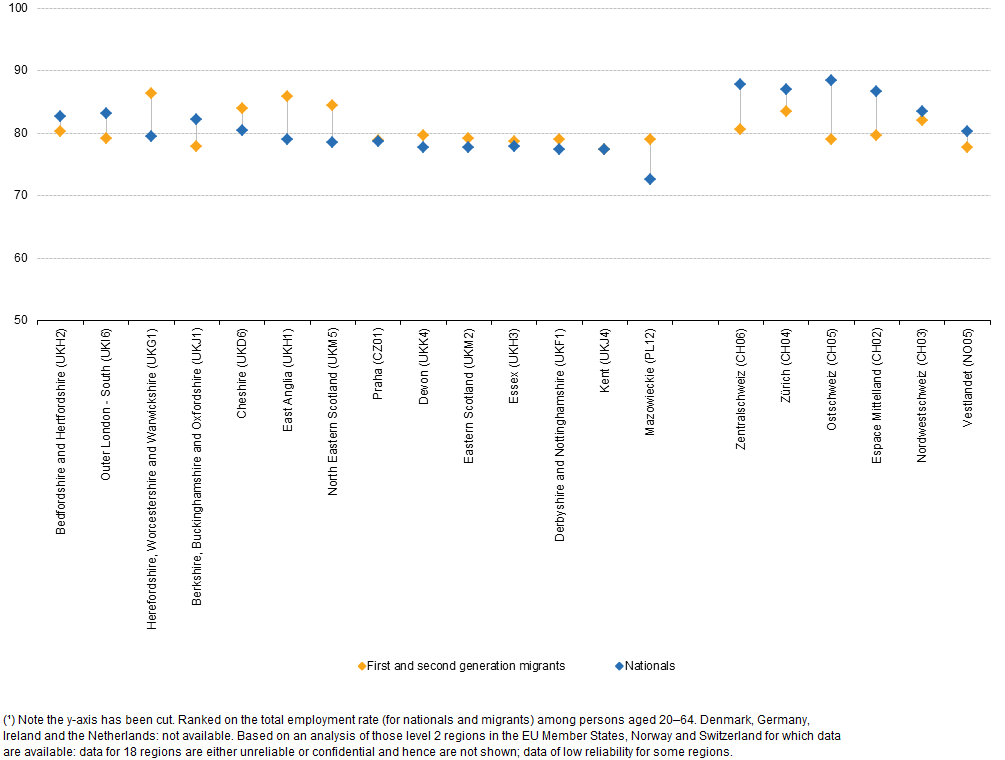
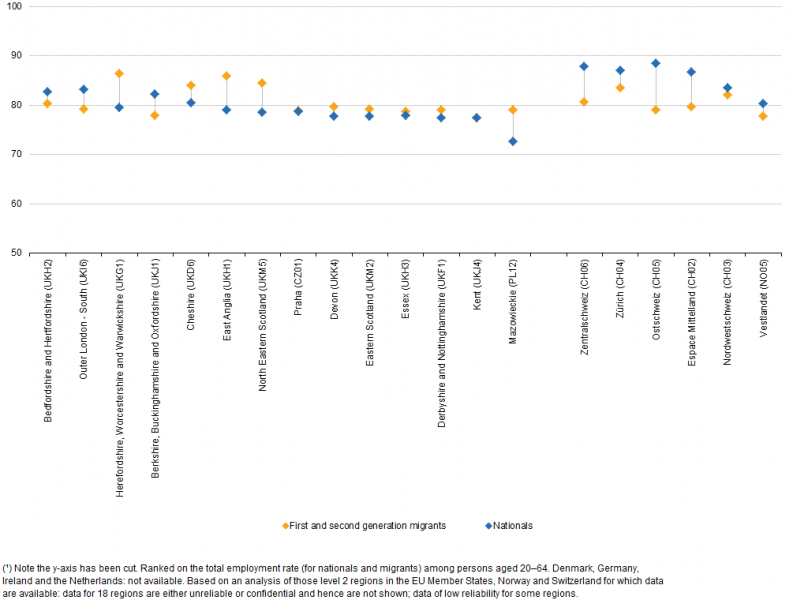
File:Employment rates by migration status, persons aged 20–64, top 20 NUTS 2 regions with the highest employment rates for migrants, 2014 (¹) (%) RYB2016.png
Revision as of 16:00, 5 July 2016 by EXT-A-Redpath (talk | contribs)
Size of this preview: 793 × 600 pixels. Other resolutions: 318 × 240 pixels | 1,005 × 760 pixels.
Original file (1,005 × 760 pixels, file size: 31 KB, MIME type: image/png)
File usage
There are no pages that use this file.
_(%25)_RYB2016.png&oldid=295607)
_(%25)_RYB2016.png)
_(%25)_RYB2016.png&action=edit&redlink=1)
_(%25)_RYB2016.png&action=history)