_(%25)_RYB2016.png)
 (%) RYB2016.png&body=Statistics Explained - Projected percentage change of the population, by NUTS 2 regions, 2015–50 (¹) (%) RYB2016.png %0A https%3A%2F%2Fec.europa.eu%2Feurostat%2Fstatistics-explained%2Findex.php%3Ftitle%3DFile%3AProjected_percentage_change_of_the_population%2C_by_NUTS_2_regions%2C_2015%25E2%2580%259350_%28%25C2%25B9%29_%28%2525%29_RYB2016.png)
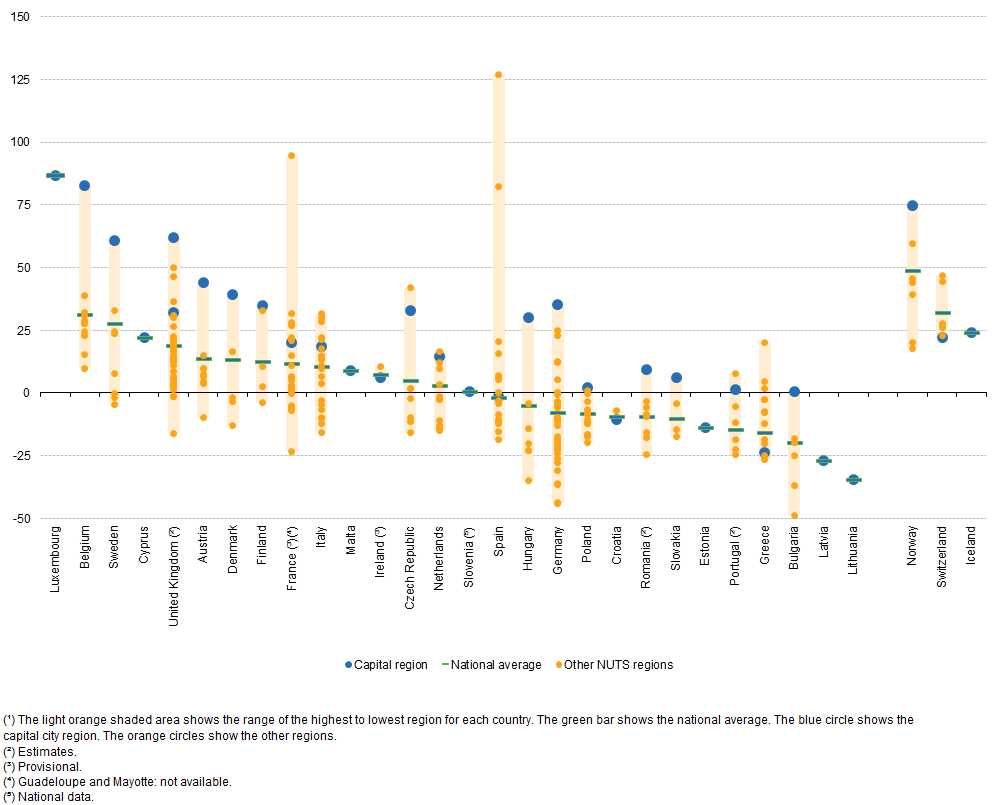
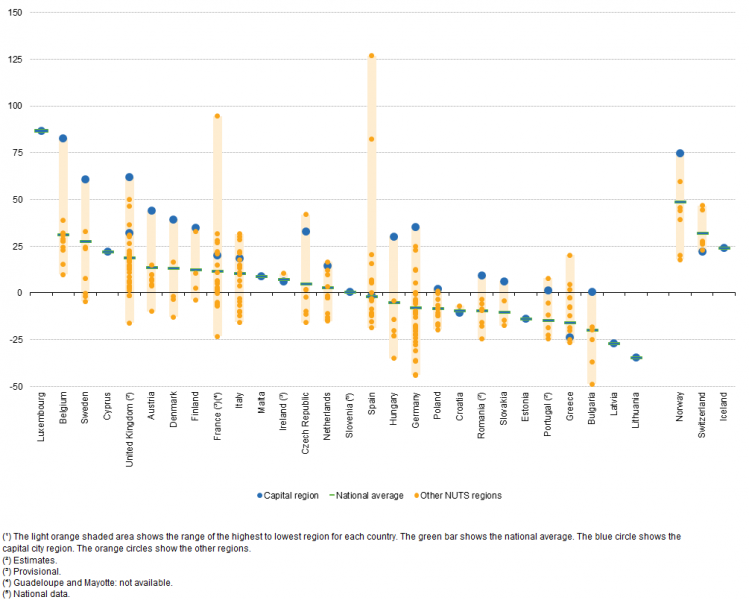
File:Projected percentage change of the population, by NUTS 2 regions, 2015–50 (¹) (%) RYB2016.png
Revision as of 13:09, 5 July 2016 by EXT-A-Redpath (talk | contribs)
Size of this preview: 749 × 600 pixels. Other resolutions: 300 × 240 pixels | 1,005 × 805 pixels.
Original file (1,005 × 805 pixels, file size: 47 KB, MIME type: image/png)
_(%25)_RYB2016.png&oldid=295505)
_(%25)_RYB2016.png)
_(%25)_RYB2016.png&action=edit&redlink=1)
_(%25)_RYB2016.png&action=history)