_(per_1_000_inhabitants)_Cities16.png)
 (per 1 000 inhabitants) Cities16.png&body=Statistics Explained - Average crude rates of population change, selected metropolitan regions, 2009–14 (¹) (per 1 000 inhabitants) Cities16.png %0A https%3A%2F%2Fec.europa.eu%2Feurostat%2Fstatistics-explained%2Findex.php%3Ftitle%3DFile%3AAverage_crude_rates_of_population_change%2C_selected_metropolitan_regions%2C_2009%25E2%2580%259314_%28%25C2%25B9%29_%28per_1_000_inhabitants%29_Cities16.png)
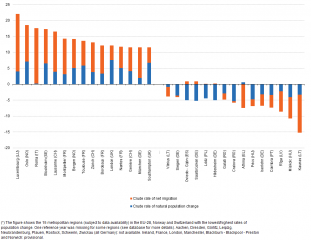
File:Average crude rates of population change, selected metropolitan regions, 2009–14 (¹) (per 1 000 inhabitants) Cities16.png
Revision as of 12:42, 29 June 2016 by EXT-A-Redpath (talk | contribs)

Size of this preview: 777 × 600 pixels. Other resolutions: 311 × 240 pixels | 1,005 × 776 pixels.
Original file (1,005 × 776 pixels, file size: 40 KB, MIME type: image/png)
File usage
The following page uses this file:
_(per_1_000_inhabitants)_Cities16.png&oldid=294459)
_(per_1_000_inhabitants)_Cities16.png)
_(per_1_000_inhabitants)_Cities16.png&action=edit&redlink=1)
_(per_1_000_inhabitants)_Cities16.png&action=history)