,_the_euro_area_and_in_the_US_(year_2012)_(in_%25_of_output)_june2016.png)
, the euro area and in the US (year 2012) (in % of output) june2016.png&body=Statistics Explained - Fig1 Sectoral structure of output in the EU (year 2014), the euro area and in the US (year 2012) (in % of output) june2016.png %0A https%3A%2F%2Fec.europa.eu%2Feurostat%2Fstatistics-explained%2Findex.php%3Ftitle%3DFile%3AFig1_Sectoral_structure_of_output_in_the_EU_%28year_2014%29%2C_the_euro_area_and_in_the_US_%28year_2012%29_%28in_%2525_of_output%29_june2016.png)
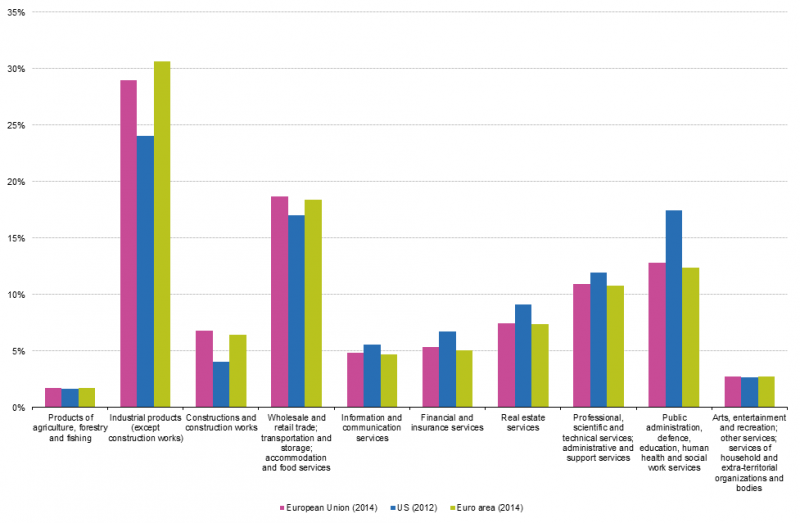
File:Fig1 Sectoral structure of output in the EU (year 2014), the euro area and in the US (year 2012) (in % of output) june2016.png

Size of this preview: 800 × 523 pixels. Other resolutions: 320 × 209 pixels | 977 × 639 pixels.
Original file (977 × 639 pixels, file size: 34 KB, MIME type: image/png)
File usage
There are no pages that use this file.
,_the_euro_area_and_in_the_US_(year_2012)_(in_%25_of_output)_june2016.png&oldid=291582)
,_the_euro_area_and_in_the_US_(year_2012)_(in_%25_of_output)_june2016.png)
,_the_euro_area_and_in_the_US_(year_2012)_(in_%25_of_output)_june2016.png&action=edit&redlink=1)
,_the_euro_area_and_in_the_US_(year_2012)_(in_%25_of_output)_june2016.png&action=history)