_of_EA_(upper_graph)_and_the_EU_(lower_graph)_final_SI.png)
 of EA (upper graph) and the EU (lower graph) final SI.png&body=Statistics Explained - The growth rates (in %) of EA (upper graph) and the EU (lower graph) final SI.png %0A https%3A%2F%2Fec.europa.eu%2Feurostat%2Fstatistics-explained%2Findex.php%3Ftitle%3DFile%3AThe_growth_rates_%28in_%2525%29_of_EA_%28upper_graph%29_and_the_EU_%28lower_graph%29_final_SI.png)
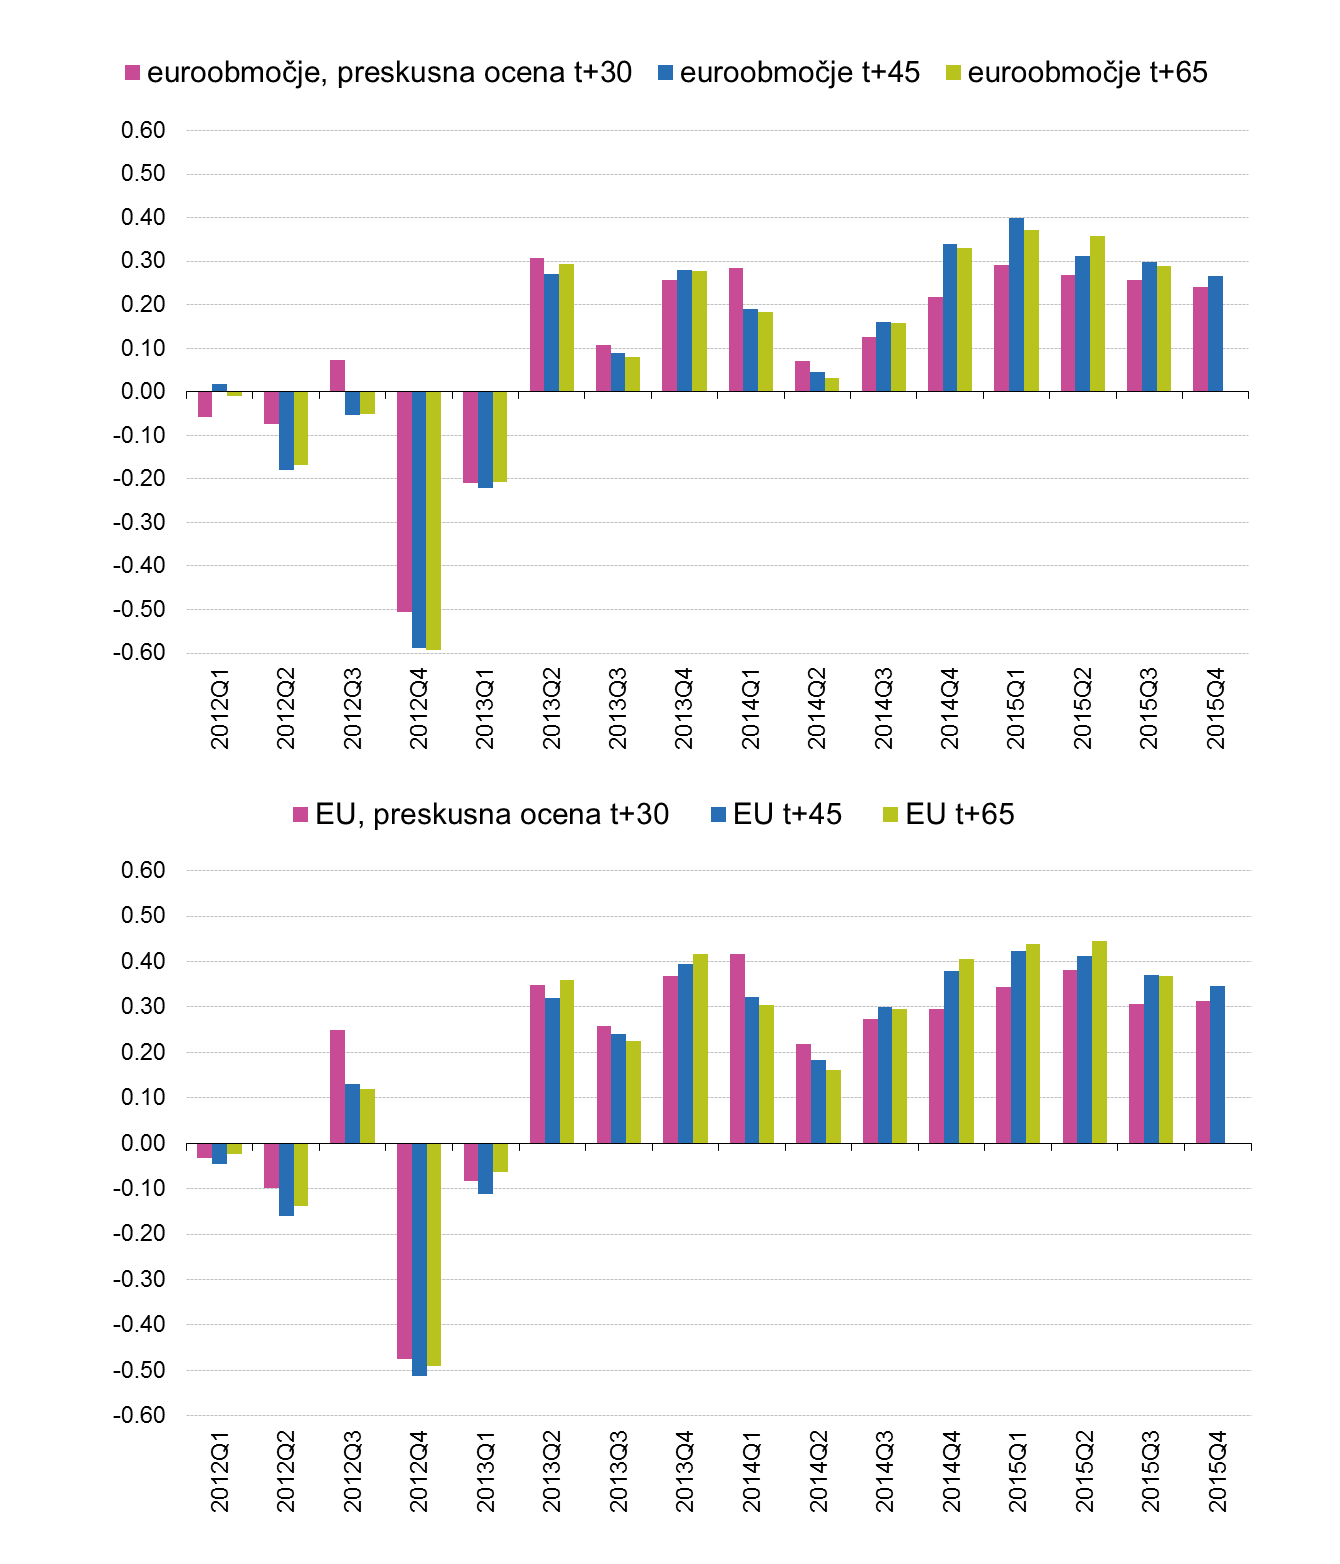
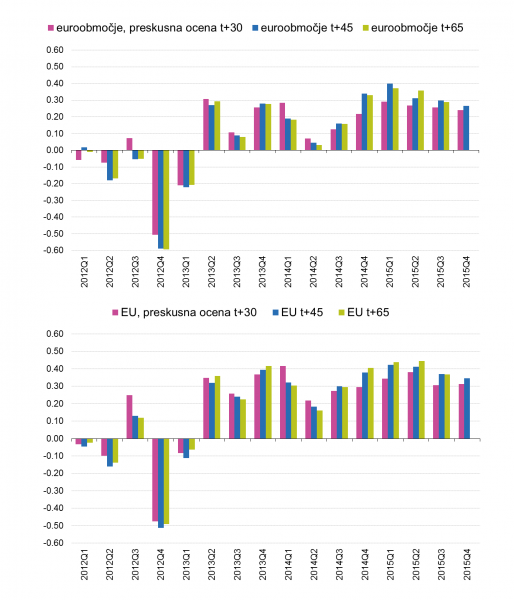
File:The growth rates (in %) of EA (upper graph) and the EU (lower graph) final SI.png
Size of this preview: 514 × 600 pixels. Other resolutions: 206 × 240 pixels | 1,340 × 1,564 pixels.
Original file (1,340 × 1,564 pixels, file size: 84 KB, MIME type: image/png)
File usage
The following page uses this file:
_of_EA_(upper_graph)_and_the_EU_(lower_graph)_final_SI.png&oldid=286287)
_of_EA_(upper_graph)_and_the_EU_(lower_graph)_final_SI.png)
_of_EA_(upper_graph)_and_the_EU_(lower_graph)_final_SI.png&action=edit&redlink=1)
_of_EA_(upper_graph)_and_the_EU_(lower_graph)_final_SI.png&action=history)