Archive:Sustainable development - socioeconomic development
- Data from July 2009, most recent data: Further Eurostat information, Database.
This article provides an overview of statistical data on sustainable development in the areas of socioeconomic development. They are based on the set of sustainable development indicators the European Union (EU) agreed upon for monitoring its sustainable development strategy. Together with similar indicators for other areas, they make up the report 'Sustainable development in the European Union - 2009 monitoring report of the EU sustainable development strategy', which Eurostat draws up every two years to provide an objective statistical picture of progress towards the goals and objectives set by the EU sustainable development strategy and which underpins the European Commission’s report on its implementation.
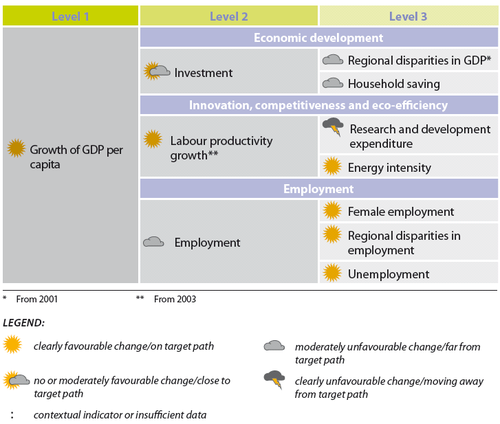
The table below summarizes the state of affairs of in the area of socioeconomic development. Quantitative rules applied consistently across indicators, and visualized through weather symbols, provide a relative assessment of whether Europe is moving in the right direction, and at a sufficient pace, given the objectives and targets defined in the strategy.
Overview of main changes
Overall, most trends were positive over the period 2000 to 2007 in the socioeconomic development theme. However, the picture is mixed and some areas showed slow, or even no, progress. Economic growth continued throughout the period, while regional disparities grew and households were saving less. Most of the employment indicators progressed in line with the Lisbon targets, but the overall employment rate was lacking in impetus. Labour productivity increased and energy intensity decreased in line with EU objectives. More spending on research and development is needed if the target is to be reached.
If it were possible to take the recent economic and financial crisis into account, however, the picture would be radically different. The latest data from 2008 and forecasts for the coming years indicate a sharp decline of economic growth.
Main statistical findings
Headline indicator
Growth of GDP per capita
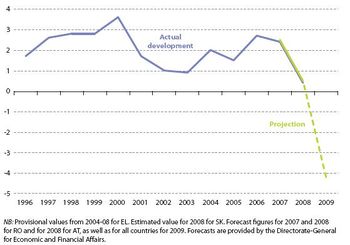
Economic growth in the EU-27 developed favourably over the period 2000 to 2007. The upturn was not as strong, however, as in the previous economic cycle. Data for 2008 show a sharp decline, as do forecasts for 2009
- GDP growth picks up after 2000, but with rates lower than in the late 1990s
Economic growth, measured as the growth rate of GDP per capita, reflects the phases of the economic cycle. After a peak in 2000 of 3.6 %, growth rates fell to 0.9 % in 2003. In the subsequent economic upturn the growth rate climbed to 2.7 % in 2006, which was not quite sustained in 2007, and was followed by a substantial drop in 2008. The overall annual average growth rate over the period 2000-08 was 1.8 %. The high rates of economic growth, which had prevailed between the mid-1990s and 2000, were not attained during the present economic cycle.
- Downturn projected for 2009
The economic upturn came to a sudden end in 2008 resulting in a fall of the growth rate down to 0.4 %. In the current global economic crisis, forecasts suggest that the GDP per capita growth rate will slump to a negative value of -4.2 % in 2009 [1].
- New Member States catching up with sustained high rates of economic growth
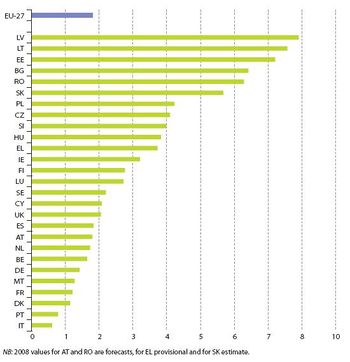
Until 2007 economic growth remained strong in most of the eastern European Member States, with several showing average growth rates of more than 6 % over the period from 2000 to 2007 and even as high as 9.4 % in Latvia. This being far higher than the EU-27 average of 2.0 %. The high growth in these countries, largely driven by exports, was expected to contribute to a progressive shrinking of the difference in economic output between the newer and the established Member States (‘catching-up effect’)[2] .
- Financial crisis hit new Member States
At the same time the new Member States are being hit strongly by the financial crisis. The sharpest declines between 2007 and 2008 occurred in these countries. Latvia’s high growth rate of 10.6 % in 2007 fell by 14.8 percentage points to ‑4.2 % in 2008. In Estonia the growth rate fell by 10 percentage points and four other new Member States experienced drops of more than 3 percentage points. Forecasts show negative rates for most of these countries for 2009.
Economic development
Investment
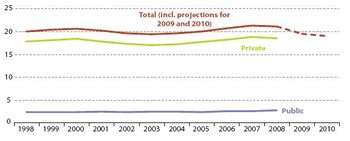
The ten-year average of the EU-27 gross investment rate amounts to 20 %. The investment rate stood at 21.2 % of GDP in 2008
- Modest changes in investment rate reflect fluctuations in business investment
During the economic downturn of 2000 to 2003, the share of total investment in GDP fell to a low of 19.4 %, due to the slower development of business investment. Since 2003, total investment spending has been steadily rising at a higher rate than GDP as a consequence of expanded business spending fuelled by favourable economic conditions, resulting in an investment rate of 21.3 % in 2007. This amount is 0.7 percentage points higher than in the previous cyclical peak of 2000. As the share of public investment in GDP has remained stable since 2000 at around 2.4 %, it is mainly business investment which has made the difference in influencing total investment.
- Stimulus packages to restore confidence
Not surprisingly, in the light of the current economic crisis and because investment spending is typically a strongly cyclical and volatile component of GDP growth, forecasts for the next years show a considerable cutback in total investment down to 19 % of GDP in 2010. Despite the considerable uncertainty in these forecasts, the projection for 2009 is supported by recent data which show a sharp decline of 10.7 % of seasonally adjusted gross investment in the first quarter of 2009 compared to the previous year (10). In order to anti-cyclically compensate for the foreseeable decline in business investment, cohesion policy, which is aimed at strengthening public investment, especially in the economically least-developed regions (11), has been re-emphasized in the European Economic Recovery Plan. Cohesion policy is planned to account for almost 6 % of expected GDP on average over the period 2007 to 2013. The envisaged measures are intended to stimulate private investment and consumption by restoring business and consumer confidence in the economy.
Regional disparities in GDP
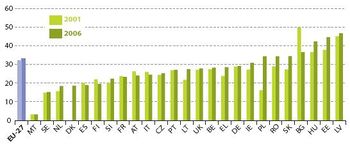
Economic wealth is less and less equally distributed among regions. Between 2001 and 2006, in the EU-27 and in most EU Member States, disparities of GDP per capita between NUTS-3 regions have been increasing
- Dispersion of regional GDP highest in eastern European countries
In 2006, within-country dispersion rates of regional GDP exceeded 30 % in eight European countries; seven of which are located in eastern Europe. The rapid transition into market economies has apparently led to high and ongoing polarisation of economic output and an uneven distribution of wealth amongst the regions. Between 2001 and 2006 the within-country dispersion rate of regional GDP rose in 18 out of 24 Member States and there were favourable developments in only a few countries. In 2006, the highest rates of dispersion of regional GDP were in Latvia, Estonia, Hungary and Bulgaria, followed by Slovakia, Romania and Poland. The lowest rate of disparity in 2006 was found in Malta (with only two regions), and in Sweden, the Netherlands, Finland and Spain. Overall, the dispersion rate grew in the EU-27 by 1.1 percentage points between 2001 and 2006 (from 32 % to 33.1 %).
Household saving
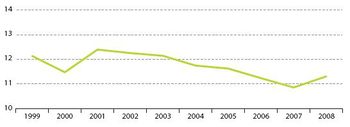
The share of saving in the disposable income of households fell between 2001 and 2007 in the EU-27, although experienced an upturn in 2008. The saving rate differs considerably between Member States
- Sharp increase in household saving with arrival of financial crisis
In response to the economic downturn over the years 2001 to 2003, the saving rate, representing the part of households’ disposable income not used for final consumption, climbed to 12.4 % in 2001 and then fell steadily at a modest rate during the following years of economic upturn until 2007. It then experienced an upturn in 2008, reaching a level of 11.3 %. Most likely low interest rates, combined with low and stable inflation, led to an increasing credit demand from consumers, reducing their propensity to save. The saving rate shows significant differences across EU Member States with figures ranging from -4.3 % to +16.7 % in 2007. Since short-term increases in the saving rate are often linked with pessimism about the future of the economy and movements in the interest rate, it is not surprising that household savings rose in the fourth quarter of 2008 and reached 13.8 % in the first quarter of 2009.
Innovation, competitiveness and eco-efficiency
Labour productivity growth
Labour productivity of the EU-27 countries is growing but at a slower rate than in 2003. Despite convergence, considerable differences between Member States persist
- Slower growth in labour productivity
- Cross-country differences remain
The growth rate in EU-27 labour productivity has fallen from 2.2 % in 2003 to 1.1 % in 2007. This has been largely due to a decline in the previously high growth rates of eastern European countries.
The slowdown in labour productivity growth between 2003 and 2007, during an economic upswing, might be explained by many factors, such as declining investment per employee, slowdown in the rate of technological progress, sluggish reorientation of the economy toward sectors with high productivity, a relatively small size of the EU’s information and communication technology industry (15) and, not the least, a stagnating share of R & D expenditure in GDP (see indicator on ‘R & D expenditure’). Despite some convergence of labour productivity growth rates over these five years, which was primarily driven by the slow-down in catchingup of Member States in the eastern part of the EU, large differences between countries remain. In 2007, there were six countries with growth rates higher than 4 %.
Even though an EU-27 aggregate for 2008 is not yet available at the moment, several Member States’ growth rates sharply declined. Furthermore, out of 14 Member States which have already produced growth figures, nine have negative growth rates. At this stage it is too early to draw firm conclusions, but this negative trend may be explained by the economic crisis.
Research and development expenditure
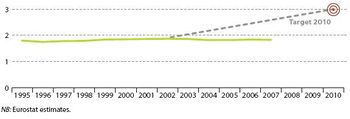
EU spending on research and development remains far from the target value of 3 % of GDP in 2010
- R & D expenditure far from target path
The share of R & D spending as a percentage of GDP remained at about 1.8 % over the period 2000 to 2007. R & D expenditure has thus made no significant progress towards the target of 3 % of GDP set for 2010. At 1.85 % in 2007, this share is below the OECD average of 2.3 %; and both the USA and Japan (at 2.3 % and 2.1 % respectively) devote higher shares of their budgets to R & D (2006 data).
Although most Member States have set national targets, these are rarely translated into budgetary reality, and only Finland and Sweden exceed the 3 % target. In 2007, as in the past, Sweden led with a share of 3.6 % which also gives it a high ranking globally. It was closely followed by Finland with 3.5 %. Austria, Denmark and Germany stood at about 2.5 %. However while Denmark and Germany have only made marginal increases in R & D spending, Austria, on the other hand, increased it spending relative to GDP by 0.6 percentage points. It is Estonia which raised its share the most from 0.6 % to 1.1 % and the largest decline took place in Slovakia where R&D budget was reduced by 0.2 percentage points from 2000 to 2007. Besides Slovakia eight other Member States decreased their contribution over this period.
Energy intensity
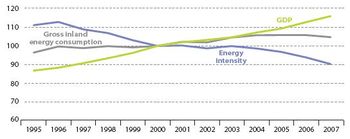
The energy intensity of the EU-27 economy decreased significantly between 2000 and 2007 and the target of 1 % annual reduction in energy intensity has been achieved
- Energy intensity development shaped by economic growth
- Decrease since 2000 sufficient to meet target
The development of energy intensity shows a strong link to the economic cycle: It decreased from 1996 to 2000, remained constant from 2000 to 2003, and further decreased from 2003 to 2007.
Viewed in more detail, between 1995 and 2000 gross inland energy consumption grew at an average rate of 0.7 % per year, much slower than the GDP increase of 2.9 % per year on average. As a result, energy intensity decreased by 2.1 % per year on average in that period. Since 2000, gross inland energy consumption continued to increase by an average of 0.7 % per year, whilst GDP rose at an average rate of 2.2 % between 2000 and 2007. This resulted in a reduction of energy intensity of 1.5 % per year on average. Although interrupted by the economic downswing from 2000 to 2003 the overall decline in energy intensity has been sufficient to meet the target of 1 % reduction per year on average.
Employment
Employment
With the exception of a slight decline in 2002, employment rates increased in the EU-27 over the last decade. However, the interim target of 67 % by 2005 was not reached and annual average growth of the indicator would need to speed up considerably to meet the EU target of 70 % by 2010
- Employment rate follows economic cycle with a time lag
- Crisis may put 70 % target out of reach
- Education is an important determinant of employment
Between 2000 and 2008, the employment rate in EU-27 rose by 3.7 percentage points from 62.2 % to 65.9 %, but remains three years behind the linear target path. The steady increase was interrupted only in 2002 in response to a slowdown of investment at that time (see indicator on ‘Investment’). The annual increase in the employment rate remained comparatively low until the economy recovered in 2004 and its growth was insufficient to reach the intermediate employment target of 67 % in 2005. Differences between EU Member States are sizeable, with employment rates ranging in 2008 from 55.2 % for Malta to 78.1 % in Denmark.
If the employment rate continues to rise at the average annual rate of change so far (0.46 percentage points per year between 2000 and 2008), the 70 % target set for 2010 is unlikely to be met. Achieving this target in time would require an average annual increase of 2.05 percentage points in 2009 and 2010. This does not seem feasible given the current economic crisis, which has already led to a decrease in employment rate in the EU-27 for the last two quarters of 2008 and for the first quarter of 2009.
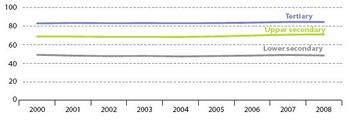
The figure "Employment rate, by highest level of education attained" below shows that the employment rate is the greater the higher the level of education attained. In 2007, more than four-fifths of 25 to 64 year olds with a tertiary level educational qualification were employed, but less than half of persons with lower secondary education. The employment rates within the three analysed education subgroups have remained almost constant over time. It is therefore likely that the increase of employment is at least partially due to shifts from lower to higher education.
Female employment
The gap between male and female employment continues to shrink. As a result the rate of female employment is well on track towards the target of 60 % female employment by 2010
- Convergence to male employment strongest in economic upswing
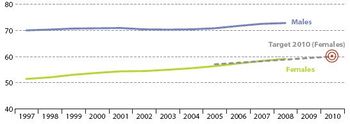
Over the period from 2000 to 2008, female employment rose continuously, shrinking the distance from male employment. Interestingly, this convergence was stronger during 2005 to 2007, which were years of economic upturn, than when economic conditions were less favourable (2000 to 2003 and since 2008). In 2008, the female employment rate was 59.1 %, which was the second consecutive year above the theoretical linear target path. By 2008, 15 Member States had already exceeded the 60 % female employment target. Nevertheless, considerable differences remain among Member States with rates varying between 37.4 % and 74.3 %.
Regional disparities in employment
The dispersion of regional employment rates fell by nearly 2 percentage points between 2000 and 2007
- Reduction of regional disparities falls together with economic upturn
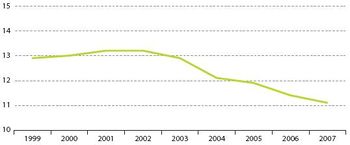
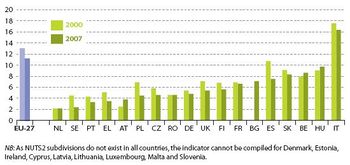
The dispersion of regional employment grew slowly between 1999 and 2003 and then steadily decreased over the period from 2003 to 2007, which was characterized by favourable economic conditions. In 2007 the indicator stood at 11.1 %, which was 1.9 percentage points lower than in 2000. Over that period disparities were reduced in 12 of the 18 EU countries for which the indicator can be computed. In 2007, 17 of 18 Member States report dispersion of regional employment rates within their territories below the dispersion within the EU as a whole.
Unemployment
In line with the economic upturn, overall EU unemployment decreased between 2004 and 2008 and reached a lower level than in the previous economic cycle. Age and gender disparities were reduced, but they remain important issues of European social cohesion
- Unemployment follows economic cycle with a time lag
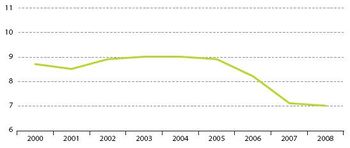
Unemployment increased between 2001 and 2003 from 8.5 % to 9.0 %, lagging one year behind the economic downturn. No change was then observed for several years until it fell in 2006 and 2007 to slightly above 7 %. This level, which was maintained under the less favourable conditions of 2008, was well below the minimum attained over the previous economic cycle. However, in 2008 unemployment increased in 10 Member States, and the latest short-term figures for 2009 indicate that the EU unemployment rate has increased sharply (up to 8.6 % in April 2009) due to the effects of the economic crisis (24).
- Young persons, women and low-skilled people hit most from unemployment
Figures on unemployment by age group and gender show that the labour market situation is worst for young people (aged 15 to 24). In 2008, 15.4 % of economically active persons in that age group were unemployed. This share is twice as high as in the population as a whole. The unemployment rate also considerably differs between countries, ranging from 3 to 11 % in 2008.
- Female unemployment less affected by economic crisis
In the EU-27 the unemployment rate of women favourably decreased by 2.3 percentage points from 9.8 % in 2000 to 7.5 % in 2008, but it still remains 1.1 percentage points higher than that of men. While male unemployment remained stable in 2008, female unemployment appeared to be less affected by the economic crisis and continued to decrease. However, the latest figures for female unemployment also show a sharp increase up to 8.3 % in March 2009.
Data sources and availability
The data presented cover the period from 1995 to 2008/9 (or the latest year available).
Detailed methodological notes on the indicators presented in this article can be found on the sustainable development indicators dedicated section of the Eurostat website.
GDP (deflated)
The deflated GDP figures are based on the chain-linked methodology with reference year 2000. When flows and stocks are valued at the price level in the accounting period they are said to be valued at current prices. Valuation at constant prices means valuing flows and stocks at the price of a previous period. The purpose of the valuation at constant prices is to assess the dynamics of economic development irrespective of price movements. This is achieved by decomposing changes of values over time into changes in prices and changes in volume. Price, value and volume are related by the equation: Value = Volume × Price
Flows and stocks at constant prices are hence said to be in volume terms. To improve the meaningfulness of volume data in view of rapidly changing price structures, Decision 98/715/EC lays down that the base year must be the previous year so that the base year is moving ahead with the observation period. A time-series of volumes is obtained by multiplying successive growth rates at previous year’s prices starting from an arbitrary reference year’s level. Due to its construction, this is called a chain-linked series. Unlike the choice for a fixed base year, the choice of reference year in chain-linking does not have any effect on growth rates.
Growth of GDP per capita
Figures are collected from the national accounts departments of Member States’ national statistical institutes. Data are expressed as growth rates in per cent. They are derived from data expressed in euro (or ecu prior 1999).
Per inhabitant figures are calculated based on the total population of a country on a given date, which consists of all persons, national or foreign, who are permanently settled in the economic territory of the country, even if they are temporarily absent from it. This means that total population is defined using the concept of residence rather than nationality. Population figures from national accounts may differ from those of population statistics.
Any GDP-derived measures for the European Union, such as GDP per inhabitant, GDP per capita growth, or labour productivity (see related indicators), are calculated directly from the European aggregates rather than from adequately weighing the derived measures for the Member States.
Investment
Data are taken from national accounts which are compiled in accordance with the European system of accounts (ESA 95). Current price statistics expressed in euro (or ‘ecu’ prior to 1999) have been used to calculate the shares. Aggregate data for the EU are, in general, derived by adding the respective Member State data, but some additional estimations or imputations have been required for the presentation of annual data.
The private sector consists of non-financial corporations, financial corporations, households and non-profit organisations serving households, i.e. all sectors of a national economy except general government which represents the public sector.
Regional disparities in GDP
For a given country the dispersion of regional GDP at NUTS3 level is defined as the sum of the absolute differences between regional and national GDP per inhabitant, weighted with the regional share of population and expressed in percent of the national GDP per inhabitant.
Concerning geographical consistency, the sums of regional data usually coincide with the national data published in national accounts. However, national GDP data are more frequently updated than regional GDP. This means that there may be a difference between the national and/or European aggregates and the corresponding sums of the regions.
Household saving
Figures are collected from national statistical institutes’ national accounts departments. The basic statistics come from many sources, including administrative data from government, censuses, and surveys of businesses and households. The data are in current prices.
Households cover individuals or groups of individuals as consumers and possibly also as entrepreneurs producing market goods and non-financial and financial services (market producers) provided that, in the latter case, the corresponding activities are not those of separate entities treated as quasi-corporations. It also includes individuals or groups of individuals as producers of goods and nonfinancial services for exclusively own final use.
As regards data for the EU, the annual household saving rate is calculated on the basis of the European quarterly sector accounts. These European accounts are slightly wider than the data received from Member States as:
- missing countries are estimated by Eurostat;
- European institutions are included;
- intra-European flows and asymmetries between Member States are removed.
Labour productivity growth
The hours worked represent the aggregate number of hours actually worked as an employee or self-employed during the accounting period, when their output is within the production boundary.
Research and development expenditure
Gross domestic expenditure on research and experimental development data are collected through the annual Eurostat R & D questionnaires and are calculated using current prices. The figures relating to GDP are compiled in accordance with ESA95.
For some countries which attract significant foreign direct investment, the use of GDP as denominator restricts relevance as while these investments are visible in GDP and high-tech export figures for countries where investment is made, R & D work may be performed in investor countries and therefore may not be visible in R&D expenditure figures for the countries where the investment is made. Measurement problems may occur in the case of multinationals.
Energy intensity Gross inland energy consumption represents the quantity of energy necessary to satisfy the inland consumption of the geographical entity under consideration. It is the sum of gross inland consumption of solid fuels, liquid fuels, gas, nuclear energy, renewable energies, and other fuels. The gross inland consumption of an individual energy carrier is calculated by adding primary production and recovered products of energy together with total imports and withdrawals from stocks minus total exports and bunkers. It corresponds to the addition of consumption, distribution losses, transformation losses and statistical differences. It is measured in tonnes of oil equivalent.
Employment and unemployment
The Labour force survey (LFS) is a quarterly household survey which provides data on persons aged 15 years and over living in private households. Its main emphasis is on employment, unemployment and inactivity. Conscripts, persons living in collective households (halls of residence, medical care establishments, religious institutions, collective workers’ accommodation, hostels, etc.) and persons carrying out obligatory military service are not included. Only the employment of the residents in the country is considered. All sectors of the economy are covered.
The concepts and definitions used in the survey are based on those contained in the Recommendation of the 13th International Conference of Labour Statisticians, convened in 1982 by the International Labour Organization (referred to as the ‘ILO guidelines’). To further improve comparability within the EU, Commission Regulation (EC) No 1897/2000, gives a more precise definition of unemployment. This definition remains fully compatible with the International Labour Organization standards. The economic active population comprises employed and unemployed persons.
The LFS divides the population of working age (15 years and above) into three mutually exclusive and exhaustive groups (persons in employment, unemployed persons and inactive persons) and provides descriptive and explanatory data on each of these categories.
- Employed persons are persons aged 15 years and over (16 and over in ES, UK and SE before 2001; 15-74 years in
DK, EE, HU, LV, SE, FI; 16-74 in IS and NO) who during the reference week performed work, even for just one hour a week, for pay, profit or family gain or were not at work but had a job or business from which they were temporarily absent because of, e.g., illness, holidays, industrial dispute or education and training.
- Unemployed persons are persons aged 15-74 (in ES, UK, IS and NO: 16-74) who (i) were without work during the
reference week; (ii) were currently available for work before the end of the two weeks following the reference week; or (iii) were either actively seeking work in the past four weeks or had already found a job to start within the next three months.
- Inactive persons are those who neither classified as employed nor as unemployed.
The quarterly LFS is used for the calculation of both the employment and unemployment rates. Any missing quarter is estimated to produce the annual average.
The education data refer to the second quarter of each year until 2004, except FR and AT (quarter 1 all years). The level is coded according to the 1997 International standard classification of education (ISCED).
Regional disparities in employment
Regional employment rates represent annual average figures and are taken from the European Union Labour Force Survey (see notes on ‘Employment and unemployment’). Although the indicator cannot be compiled for Denmark, Ireland, Luxembourg, Cyprus, Estonia, Lithuania, Latvia, Malta and Slovenia because these countries comprise only one or (in the case of Ireland) two NUTS level 2 regions, the employment rates of these countries and of the two Irish regions are used to compute the dispersion of regional employment rates for the EU as a whole.
Persons living in institutional households (halls of residence, medical care establishments, religious institutions, collective workers’ accommodation, hostels, etc.) and persons carrying out obligatory military service are not included. They represent on average less than 2 % of the working age population.
Context
Sustainable development is a fundamental and overarching objective of the European Union, enshrined in the Treaty. The EU sustainable development strategy, launched by the European Council in Gothenburg in 2001 and renewed in June 2006, aims for the continuous improvement of quality of life for current and future generations.
Background
Sustainable socioeconomic development a core element of EU SDS and Lisbon Strategy
Improving socioeconomic conditions has been one of the fundamental drivers for the vision of a united Europe and is, therefore, non-surprisingly a vital component of a number of highlevel Community policies. Two of those important policies are the Lisbon Strategy for growth and jobs [3] and the European Union’s Sustainable Development Strategy (EU SDS)[4]. Both aim at achieving a more sustainable socioeconomic development and thus outline important strategic development trajectories.
The European Council claims in the renewed EU SDS that ‘the EU SDS forms the overall framework within which the Lisbon Strategy … provides the motor of a more dynamic economy’. Against this background, the theme ‘socioeconomic development’ of this report provides the link between those two guiding strategies. Indicators in this theme to some extent overlap with indicators measuring the progress of the Lisbon Strategy.
Overarching objectives of socioeconomic development aim for the creation of a knowledgebased economy, technology transfer, promotion of employment and enhancement of human and social capital as well as reducing social exclusion. Those objectives depict the most important aspects of socioeconomic development, and are measured in terms of economic growth and competitiveness, technology and innovation potential, creation of jobs and social wellbeing as well as environmental sustainability. Considering those objectives, the renewed Community Lisbon Programme for 2008-2010 creates a direct connection to the EU SDS and the socioeconomic indicators outlined in this report.
Economic developments over the last decade allow basing analyses in this chapter on an entire economic cycle. Most notably, three phases can be clearly derived from socioeconomic data in the EU: the downturn from 2000 to 2003, the upturn from 2003 to 2007, and the recent crisis since 2008.
The economic downturn between 2000 and 2003 has been extensively documented in the 2005 and 2007 Monitoring Reports. Several socioeconomic indicators declined during this phase, including GDP per capita growth, investment, household saving, and employment related issues.
In turn, the economic upswing over the period 2003 to 2007 resulted in overall positive effects on GDP per capita growth, increasing productivity growth and recovering of investment, accompanied by low unemployment rates as well as decreasing disparities in regional employment. Although economic growth rates were not as high as during the previous upswing, favourable development could be observed in several socioeconomic indicators. Despite total employment being still far from target, employment and unemployment indicators also made considerable progress until 2007.
Effects of the crisis start to become visible in socioeconomic indicators
Regarding the third phase, the recent crisis, certain effects can already be observed in this report. Forecasts are also available. However, currently available data bear high uncertainties and make it difficult to draw a reliable picture. Certainly, the 2011 EU SDS Monitoring Report will be able to build on more complete data to analyse impacts of the crisis on socioeconomic development as well as other indicators.
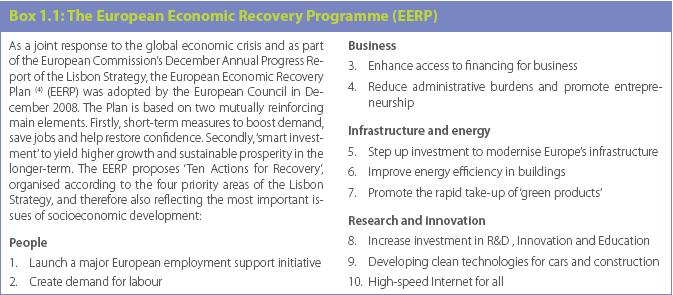
Considering the challenges of the current economic crisis and the need for cushioning the European Union from more and longer lasting negative effects on socioeconomic development, the Council adopted the European Economic Recovery Plan (EERP, Box 1.1) in December 2008. Moreover, confidence in the ability of the EU to tackle the financial and economic crisis was expressed in the 2009 spring European Council [5]. In fact, the current crisis shows how deeply social and economic issues are interconnected.
Potential linkages
Business investment, employment and unemployment cyclically linked to economic growth
Issues within the socioeconomic development theme are strongly interlinked [6]. For example, an increase or decrease in GDP per capita growth rate has effects on many other issues, as the overall economic development determines the level of financial resources available to fuel activities via public spending, business investment or private consumption. Not surprisingly, several indicators can be particularly observed to be linked to the economic cycle, either directly or indirectly, in some cases with a time lag. Although delayed, significant effects of the economic cycle can also be seen on the employment and unemployment rate, which favourably developed in times of economic upswing.
Following the same logic, effects of the positive economic development between can be linked to the significant decrease in unemployment rates which appear to respond to changes in the economic environment e.g. GDP per capita growth and investment.
The share of business investment in GDP shows a direct link to the development of the GDP per capita growth rate. While a peak in the latter was reached in 2007 (18.7 %) according to latest available data from the last quarter of 2008, investment rates also declined sharply due to the current economic turmoil.
Linkages to social inclusion
Exclusion from the labour market is a major factor of social exclusion. In addition, a rise in unemployment is likely to increase the risk of poverty, especially when lasting over long periods. Similar to overall EU GDP per capita growth, growth of regional GDP per capita can have positive effects on employment.
Linkages with demographic changes
An important challenge for socioeconomic development arises from the ageing of the population, reflected in a growing old-age-dependency ratio. This means that a continuously shrinking proportion of the population of working age needs to generate the economic resources for society as a whole. Accordingly, the employment rate, labour productivity or average annual working time (or all three variables) need to be increased in order to maintain a constant level of economic prosperity. The progress of fertility rates in recent years could represent a positive signal for the future supply of the workforce in the EU. Further, achieving the target of half of the older population in employment by 2010 will contribute to the final objectives of sustainable development.
Linkages to sustainable consumption and production and climate change
A rise in GDP per capita growth is viewed as positive for socioeconomic development, as it has several positive effects on the economy and social life. On the one hand it reflects growth in production and consumption, but on the other hand – assuming that technology does not remarkably improve or consumption and production patterns do not change dramatically – it means also a more intensive exploitation of resources. Thus, if not counterbalanced by an increase in resource productivity, an increase in GDP per capita growth may have a detrimental influence on climate change and the availability of energy and other resources on nature and biodiversity. Hence, sustainable development relies on promoting the decoupling of economic growth from environmental degradation, through resource efficiency, environmental technologies and changes in production and consumption patterns.
Further information
Publications
Database
- Indicators
- Socioeconomic Development
Dedicated section
Other information
- Commission communication, A Shared Commitment for Employment, COM(2009) 257 final
- Commission communication, A European Economic Recovery Plan (EERP), COM(2008) 800 final
- Commission communication, Implementation Report for the Community Lisbon Programme 2008 - 2010, COM(2008) 881 final 1
- Commission communication, Cohesion Policy: investing in the real economy, COM(2008) 876 final 1
- Commission communication, European Competitiveness Report 2008, COM(2008) 774 final; [SEC(2008)2853]
- Commission communication, Progress Report on the Sustainable Development Strategy 2007, COM(2007) 642 final;[SEC(2007)1416]
- Commission staff working document, Progress report on the European Union Sustainable Development Strategy 2007, SEC (2007) 1416
See also
Notes
- ↑ Eurostat news release, Euro-indicators 82/2009, Euro area GDP down by 2.5% and EU27 GDP down by 2.4%, 3 June 2009 [1]
- ↑ Commission communication, Third progress report on economic and social cohesion [2], COM(2004) 107
- ↑ Commission communication, Working together for growth and jobs - A new start for the Lisbon Strategy [3] COM(2005) 24.
- ↑ Commission communication, Review of the EU Sustainable Development Strategy (EU SDS) - Renewed strategy, [4] 10917/06
- ↑ Brussels European Council, Presidency conclusions, 19/20 March 2009, p.1.[5]
- ↑ Several EU-funded research projects, such as INDI-LINK [6], DECOIN [7], SMILE [8] and IN-STREAM [9], are working on inter-linkages between sustainable development issues and indicators.
