Archive:Biodiversity statistics
- Data from December 2014. Most recent data: Further Eurostat information, Main tables and Database. Planned article update: December 2015.

(%) - Source: Eurostat (env_bio1)
Biodiversity — a contraction of biological diversity — encompasses the number, variety and variability of living organisms, including humans. Given that we depend on the natural richness of our planet for the food, energy, raw materials, clean air and clean water that make life possible and drive our economies, most commentators agree it is imperative to seek to prevent a loss of biodiversity, since any loss may not only undermine the natural environment, but also our economic and social goals.
The challenges associated with preserving biodiversity have made this topic an international issue. This article examines two indicators for biodiversity in the European Union (EU) — information on protected areas (for terrestrial and marine biodiversity) and bird populations.
Main statistical findings
Habitats
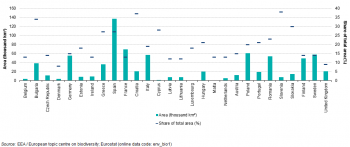
Areas protected for the preservation of biodiversity are proposed by the EU Member States under the Habitats Directive. Some 788 thousand km² of the EU-28’s terrestrial area was proposed for protection under the Habitats Directive as of 2013, around 18 % of the total land area. Compared with 2010, these latest figures show a 4 percentage point increase in the EU’s protected terrestrial area.
Figures for the EU Member States show that the proportion of the terrestrial area that was protected under the Habitats Directive in 2013 ranged between 38 % in Slovenia, 37 % in Croatia and 34 % in Bulgaria to less than 10 % of the total areas of the United Kingdom and Denmark — see Figure 1.
The largest protected terrestrial area in absolute terms was located in Spain (137 thousand km² in 2013). This area was almost twice as big as the next largest protected area, some 69 thousand km² in France. Romania, Germany, Italy, Sweden and Poland each reported 54–61 thousand km² of protected terrestrial area.
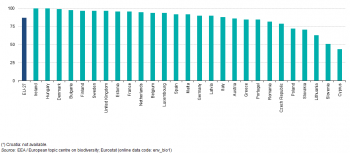
Protected terrestrial areas adequately cover most of the biogeographical regions in the EU Member States. Figure 2 provides an analysis of the sufficiency of the sites covered by the Habitats Directive, measuring the degree to which the Directive has been implemented in terms of different habitats / areas covered and number of species under protection. Using this measure, the protected terrestrial areas in the EU-27 were considered to sufficiently cover 87 % of species and habitats in 2012, while 13 % of species and habitats were not yet covered by any proposed sites. The sufficiency of sites covered by the Habitats Directive stood at 95 % or more in 10 of the EU Member States, reaching 100 % in both Ireland and Hungary. For 14 of the remaining EU Member States (no data are available for Croatia), the sufficiency of sites was within the range of 70–95 %, with lower rates in Lithuania (63 %), Slovakia (51 %) and Cyprus (44 %).
In addition to protected terrestrial areas, there were around 252 thousand km² of protected marine areas around the EU-28 in 2013. Nearly one third of this total — 74 thousand km² or 29.4 % — was located in coastal waters around the United Kingdom. French, German and Danish protected waters together accounted for just over one third of the EU-28’s protected marine area — see Figure 3.
Birds
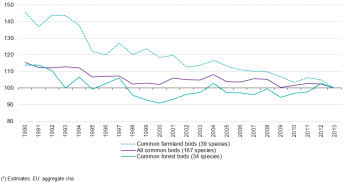
The common bird index covers 167 different species of birds across the EU. Between 1990 and 2000, there was a general decline in the EU’s populations of both common farmland birds and common forest birds. This pattern was even sharper before 2000 for common farmland birds - covering 39 species - resulting in a huge decline by 45 % overall between 1990 and 2013. Many of these losses can be attributed to changes in land use and agricultural practices, including the intensification of crop rotation patterns and of pesticide use. While the number of common forest birds in the EU - covering 34 species - declined by 23 percentage points between 1990 and 2000 (indexed on 2013), there was a small recovery during the period 2000–13, so that the overall decline between 1990 and 2013 was around 14 %, while all common species declined by 16 % in the same period.
The last two figures show the changes in the national farmland bird indicators, with data only available up to 2008. The short-term changes in the period 2000–08 are in Figure 11, while the longer-term changes in the period 1990–2008 are in Figure 12. Only 11 EU Member States (Belgium, the Czech Republic, Denmark, Germany, Estonia, France, Latvia, the Netherlands, Finland, Sweden, the United Kingdom) and Norway are covered by both figures. This is because the countries joined the pan-European common bird monitoring scheme in different years, so there are fewer data available going back to 1990. Only Latvia had an improvement in its farmland bird index between 1990 and 2008, the last year for which national data are available. Latvia also showed a positive development from 2000–08, as did Italy, Hungary, Estonia, Finland and Slovakia. The figures show that where data exist, the greatest changes already occurred long ago, even in the few countries that showed a more positive shorter-term development (Finland and Estonia).

(EUR million)
Source: EBCC / RSPB / BirdLife / Statistics Netherlands; Eurostat (online data code: env_bio3)

(EUR million)
Source: Eurostat (online data code: env_bio2)

(EUR million)
Source: Eurostat env_bio2
Data sources and availability
Habitats
Annual data are available on terrestrial and marine areas protected under the Habitats Directive (92/43/EEC) of 21 May 1992 on the conservation of natural habitats and of wild fauna and flora. The Directive protects over 1 000 animals and plant species and more than 200 types of habitat (for example, special types of forests, meadows or wetlands), which are considered to be of European importance. It has led to the creation of a network of protected sites that are proposed by EU Member States as special areas of conservation. Note that there may be additional protected areas, at a national level, that are not covered by the Habitats Directive.
The share of protected areas is an indicator which measures the compliance of each EU Member State with respect to its obligation to protect habitats and species that are typical for the wider biogeographical regions of the EU. The sufficiency index measures progress in the implementation of the Habitats Directive. It indicates the proportion of habitats and species by biogeographical region and country that are deemed to be sufficiently represented in the list of sites proposed by EU Member States, in relation to the number of species and habitats on the EU reference lists of habitat types and species in the same biogeographical regions.
Birds
Across the EU, the conservation of wild birds is covered by a Council Directive (79/409/EEC) of 2 April 1979 (often referred to as the Birds Directive). Birds are considered to be good proxies for measuring the diversity and integrity of ecosystems as they tend to be near the top of the food chain, have large ranges and the ability to move elsewhere when their environment becomes unsuitable; they are therefore responsive to changes in their habitat.
The bird indicators presented in this article measure the development of bird populations. They are designed to capture the overall, average changes in population levels of common birds to reflect the health and functioning of the ecosystems they inhabit. The population index of common birds is an aggregated index (with base year = 1990, or the first year that each EU Member State entered the scheme) of population estimates for a selected group of common bird species. Indices are calculated for each species independently and are then combined to create a multi-species EU indicator by averaging the indices, using a geometric average based on equal weights for each species.
The EU index is based on data from 20 EU Member States (data for Greece, Cyprus, Croatia, Lithuania, Luxembourg, Malta, Romania and Slovenia are not available), derived from annually operated surveys of national breeding birds collated by the Pan-European Common Bird Monitoring Scheme (PECBMS); these data are considered as a good proxy for the whole of the EU.
Three different indices are presented:
- common farmland birds (39 species);
- common forest birds (34 species);
- all common birds (167 species).
For the first two categories, the bird species have a high dependence on agricultural or on forest habitats in the nesting season and for feeding. Both groups comprise both year-round residents and migratory species. The aggregated index comprises farmland and forest species together with other common species that are generalists, meaning that they occur in many different habitats or are particularly adapted to life in cities.
Context
Many aspects of the natural environment are public goods, in other words, they have no market value or price. As such, the loss of biodiversity can often go undetected by economic systems. However, the natural environment also provides a range of intangibles, such as the aesthetic pleasure derived from viewing landscapes and wildlife, or recreational opportunities. In order to protect this legacy for future generations, the EU seeks to promote policies in a range of areas to ensure that biodiversity is protected through the sustainable development of, among others, agriculture, rural and urban landscapes, energy provision and transport.
The EU’s biodiversity strategy is based on the implementation of two landmark Directives, the Habitats Directive (92/43/EEC) of 21 May 1992 and the Birds Directive (79/409/EEC) of 2 April 1979. Implementation of these Directives has involved the establishment of a coherent European ecological network of sites under the title Natura 2000. At the end of December 2013, Natura 2000 counted around 26 410 sites and a land area of 788 thousand km² (and a total of 27 308 sites and an area of just over 1.0 million km² including marine sites) where plant and animal species and their habitats were protected. Establishing the Natura 2000 network may be seen as the first pillar of action relating to the conservation of natural habitats and the EU seeks to expand Natura 2000 in the coming decades. However, EU legislation also foresees measures to establish a second pillar through strict protection regimes for certain animal species (for example, the Arctic fox and the Iberian lynx, both of which are under serious threat of extinction).
In 1998, the EU adopted a biodiversity strategy. Four action plans covering the conservation of natural resources, agriculture, fisheries, and economic and development cooperation were subsequently agreed as part of this strategy in 2001.
In May 2011, the European Commission adopted the Communication ‘Our life insurance, our natural capital: an EU biodiversity strategy to 2020’ (COM(2011) 244 final), aimed at halting the loss of biodiversity and ecosystem services in the EU by 2020. Biodiversity loss is seen as a considerable challenge in the EU, with around one in four species currently threatened with extinction and 58 % of fish stocks over-exploited or significantly depleted. There are six main targets and 20 actions to help reach this goal. The six targets cover:
- full implementation of EU nature legislation to protect biodiversity;
- better protection for ecosystems and more use of green infrastructure;
- more sustainable agriculture and forestry;
- better management of fish stocks;
- tighter controls on invasive alien species;
- a bigger EU contribution to averting global biodiversity loss.
The strategy is in line with two commitments made in March 2010:
- the 2020 headline target — halting the loss of biodiversity and the degradation of ecosystem services in the EU by 2020, and restoring them insofar as feasible, while stepping up the EU’s contribution to averting global biodiversity loss;
- the 2050 vision — which foresees that by 2050, the EU’s biodiversity and the ecosystem services it provides — its natural capital — are protected, valued and appropriately restored for biodiversity’s intrinsic value, and for their essential contribution to human well-being and economic prosperity, and so that catastrophic changes caused by the loss of biodiversity are avoided.
The strategy is also in line with global commitments made in Nagoya (Japan) in October 2010, in the context of the Convention on biological diversity, where world leaders agreed a package of measures to address global biodiversity loss over the coming decade; there were 92 signatories to this United Nations protocol, while 69 countries ratified it. The Nagoya Protocol entered into force on 12 October 2014.
In 2015, the European Commission reviewed the EU biodiversity strategy to 2020 at its mid-term, to see whether it was on track to reach its targets. The review found that no significant progress towards the 2020 headline target had been made. The only target found to be on track was the one on combating invasive alien species.
See also
Further Eurostat information
Publications
Main tables
- Environment, see:
- Biodiversity (t_env_biodiv)
- Sufficiency of sites designated under the EU Habitats directive (tsdnr210)
- Common bird index (tsdnr100)
Database
- Environment (env), see:
- Biodiversity (env_biodiv)
- Protected Areas for biodiversity: Habitats Directive (env_bio1)
- Common farmland bird index (env_bio2)
- Common bird indices by type of estimate (EU aggregate) (env_bio3)
- Fish catches from stocks outside safe biological limits: Status of fish stocks managed by the EU in the North-East Atlantic (env_biofish1)
Source data for tables and figures (MS Excel)
Other information
- Communication 'Halting the loss of biodiversity by 2010 — and beyond — Sustaining ecosystem services for human well-being' COM(2006) 216 final
- Communication 'Our life insurance, our natural capital: an EU biodiversity strategy to 2020' (COM(2011) 244)
- Directive 79/409/EEC ('Birds Directive') of 2 April 1979 on the conservation of wild birds
- Directive 92/43/EEC ('Habitats Directive') on the conservation of natural habitats and of wild fauna and flora
External links
- Convention on Biological Diversity (UNEP — United Nations Environment Programme)
- EBCC — European Bird Census Council
- European Commission — Directorate-General for the Environment — Biodiversity & Nature

