Archive:Marriages and births in Estonia
Marriages, divorces and live births in Estonia
- Author: Mihkel Servinski, Principal Analyst at Statistics Estonia
- Data extracted in June 2015.
This article on marriages and births is part of a pilot project implemented by Eurostat together with eight Member States (Estonia, Spain, Latvia, Croatia, the Netherlands, Romania, Slovenia and Sweden). The aim of the pilot project is to better reply to user's needs by complementing the Eurostat article presenting data on an EU level with more detailed information on the same topic, but at national level. Articles from the eight Member States are available in the corresponding national languages as well as in English and they form, together with the Eurostat article, an online publication.
This article provides a brief overview of the main trends of marriages, divorces and births in Estonia. Legal marriage vs. cohabitation – the Estonian society has been rather indifferent in this respect. The average age of men and women at first marriage is on the rise and the age of mothers at birth of the first child is trending upwards.
Main statistical findings
Marital status of population aged 20 and over
According to the Population and Housing Census 2011, there were 1 026 925 inhabitants aged 20 and over in Estonia and the largest proportion of them, 41.5 %, were legally married. The share of single people in the population was 32.0 % according to the 2011 census (Figure 1). A closer look at the data reveals that they hide some nuances which may seem surprising at first: out of the
425 888 legally married persons 377 900 persons live with their legal spouse, while 5 556 persons are legally married but live with a cohabiting partner.
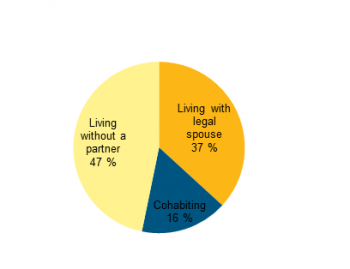
If the number of persons living with their legal spouse and the number of those cohabiting are summed up, it turns out that 42 432 persons are legally married but live without a partner. The distribution of persons aged 20 and over in Estonia by de facto marital status is shown in Figure 2. Among the population aged 20 and over, 47 % live without a partner. This figure is not small, and perhaps this is where the reasons for the insufficient birth rate in terms of population reproduction in Estonia should be looked for. The distribution of women in Estonia by de facto marital status and age group (Figure 3) shows that a large share of women without a partner are in their prime childbearing age.
Marriages, crude marriage rate, age of males and females at first marriage
In 2014, 6 220 marriages were contracted in Estonia. The number of contracted marriages is closely related to the economic situation – in boom years the number was on an upward trend, while in times of economic recession the number of contracted marriages was also in decline (Figure 5). It is fairly natural that
the crude marriage rate follows the same trend as the number of marriages (Figure 8).
The correlation (r) between the gross domestic product (GDP) and the crude marriage rate is 0.632.
In 2013, the average age of men and women in Estonia at first marriage was
31.3 and 28.8 years respectively, and this indicator is rising for both males and females (Figure 6). For men, the age at first marriage is higher, as expected, and the age gap between men and women at first marriage has not changed significantly in 2000–2013, remaining between 2.5–3 years.
The share of cohabiting persons among the population aged 20 and over is 15 % in Estonia and this level is comparable with that in Sweden.
Divorces
In 2014, 3 218 marriages were dissolved in Estonia – 517 marriages per 1 000 marriages contracted that year. In 2000–2010, the number of divorces was on a downtrend, but starting from 2011 the number has been increasing slightly (Figure 7). The number of divorces per 1 000 marriages contracted in the same year declined in the period 2000–2007. In the following years, there have been noticeable changes but, broadly speaking, it could be said that the trend has shown a certain level of stability. However, it should be noted that, in essence, the statistics on contracted and divorced marriages reflect the contracted and dissolved partnerships rather poorly – there is an increasing number of partnerships which are not officially recorded.
If the number of divorces is also examined in the context of economic development, then it turns out that contracting and divorcing marriages follow different trends in relation to economic growth: in the period of economic boom, the crude marriage rate increased, while the crude divorce rate decreased; during the recession, however, both indicators dropped (Figure 8). The correlation between the GDP and the crude divorce rate in Estonia is –0.566, which is entirely appreciable.
Births
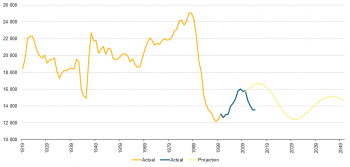
The number of live births and its dynamics is justifiably the most topical issue in relation to the demographic situation in Estonia. Figure 9 shows the number of live births in Estonia in 1919–2050. For the period of 2010–2050, a more pessimistic version of Statistics Estonia's population projection has been presented. The current number of births is one of the smallest in the history of the Republic of Estonia – even during World War II more children were born in Estonia than at present. In 1987 and 1988, over 25 000 children were born in Estonia, while in 2013 and 2014 there were only 13 500. According to Statistics Estonia's pessimistic projection, the number of children born in Estonia in 2014 should have exceeded 16 500 but it stood at 13 500. A small number of births is a major problem in Estonia, because the state is finding it difficult to develop a working economic system under the conditions of a declining population.
In 2000–2013, the average age of mothers at the birth of the first child increased slightly (Figure 10), but mothers in Estonia, at 26.5 years, are still rather young compared to the European Union average.
In Estonia, the share of children born outside marriage is above 58 %.
A comparison of the figures for 2000 and 2012 shows that this has increased by four percentage points (Figure 11).
The trend in the total fertility rate, which is an important indicator in terms of population reproduction, is changing in Estonia – growth is being replaced by decline (Figure 12). Such a change is definitely not a positive development, but rather a natural result of the demographic processes taking place in Estonia.
See also
External links
[[Category:<Population>|Marriages and births in Estonia]]
[[Category:<Statistical article>|Marriages and births in Estonia]]
[[Category:<Marriages and divorces>|Marriages and births in Estonia]]


