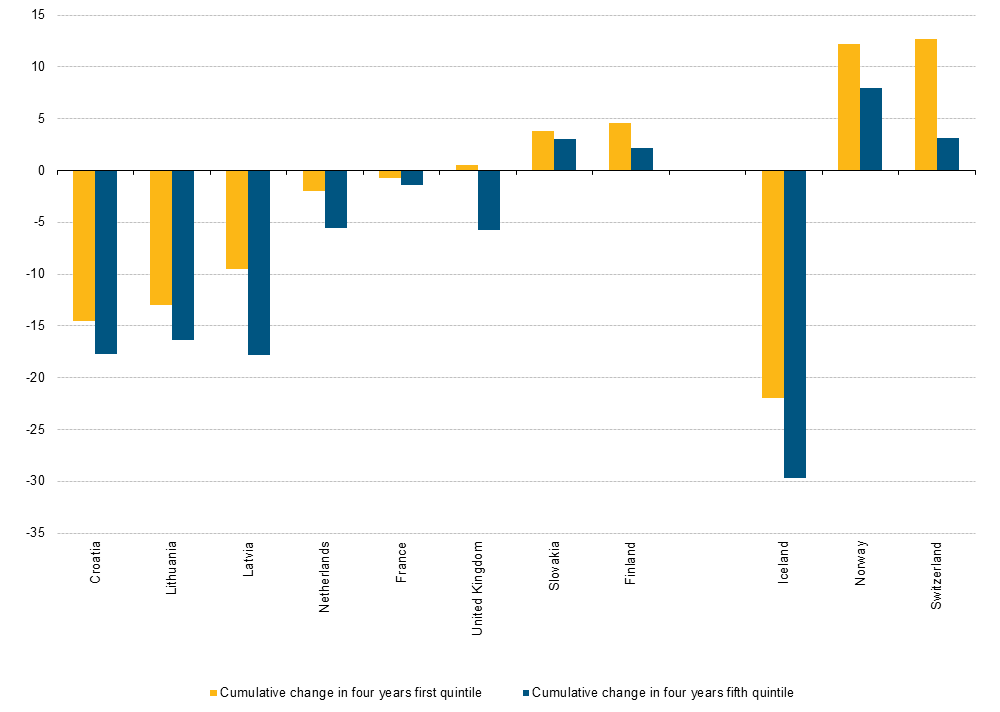
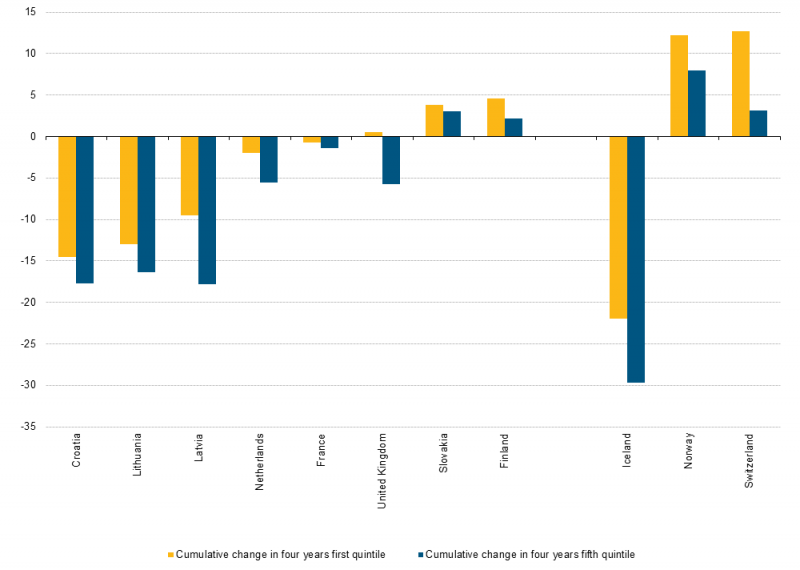
File:Change where top quintile has a bigger loss and smaller increase than bottom quintile from 2008-2012.png
Size of this preview: 800 × 570 pixels. Other resolutions: 320 × 228 pixels | 1,000 × 712 pixels.
Original file (1,000 × 712 pixels, file size: 20 KB, MIME type: image/png)
File usage
There are no pages that use this file.