Archive:Quality of life in Europe - facts and views - introduction
This article is part of a set of statistical articles based on the Eurostat flagship publication ' Quality of life in Europe - facts and views' (which can be consulted in order to get a layouted pdf version).
In late 2013 Eurostat introduced a new type of publication, the ‘flagship publication’, with the aim of providing statistical analyses related to important social, economic or environmental phenomena. The goal for these publications was to address specific themes that are highly relevant for the general public and the European Union (EU) policy-making.
Quality of life — facts and views is part of this new breed of publications and presents different aspects of people’s well-being combining for the first time objective indicators with individuals’ subjective perception. It covers for instance the labour and health status, the living environment as well as the family and financial situation. Data are presented for the EU and its Member States as well as for the EFTA countries.
Quality of life — facts and views provides an overview of the wealth of information that is available on Eurostat’s website and within its online databases.

Source: Eurostat (nama_10_pc)
Why this publication?
Traditionally official statistics describe economic developments by using indicators such as the gross domestic product (GDP) (Figure 1). However GDP alone is not enough to inform us on how well (or badly) people and our environment are doing.
Hence, the statistical gaps need to be filled in order to complement GDP with indicators that monitor social and environmental progress.
In August 2009, the European Commission published a communication titled ‘GDP and beyond — Measuring progress in a changing world' (COM(2009) 433). Its goal was to better reflect the policy and societal concerns through improving, adjusting and complementing GDP with indicators that monitor social and environmental progress.
In September 2009, the Commission on the Measurement of Economic Performance and Social Progress published a report, the so-called Stiglitz/Sen/Fitoussi Commission report, with 12 recommendations on how to better measure economic performance, societal well-being and sustainability.
In 2011, the European Statistical System Committee (ESSC) adopted a report, on ‘Measuring progress, well-being and sustainable development’. The report summarises 50 specific actions, to be taken by the European Statistical System (ESS), to implement recommendations on:
- Multidimensional measurement of the quality of life;
- Household perspective and distributional aspects of income, consumption and wealth; and
- Environmental sustainability.
In order to carry out the multidimensional measurement of quality of life, two main streams of actions were launched: developing a set of indicators (mainly based on existing data) and collecting new data.
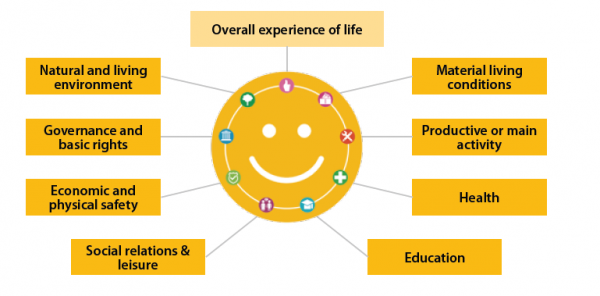
Quality of life is a broader concept than economic production and living standards. It includes the full range of factors that influence what people value in living, beyond the purely material aspects. Quality of life being a multidimensional concept, the set of indicators was developed and organised along 8+1 dimensions which constituted the ‘quality of life’ framework. In this framework, the dimensions can be measured statistically to represent the different complementary aspects of quality of life, complementing the indicator traditionally used as the measure of economic and social development, the GDP. Eight of these dimensions relate to people’s capabilities to pursue their self-defined well-being, according to their own values and priorities. The last dimension ‘overall experience of life’ refers to the personal perception of quality of life (i.e. life satisfaction, affects, meaning of life).
In 2013 Eurostat introduced an ad-hoc module on subjective well-being within the statistics on income and living conditions (EU-SILC). A set of variables with subjective appreciations of life in general but also several dimensions of quality of life complemented the data collected on income and living conditions (which is heavily used in the context of poverty and social exclusion analysis).
The objective dimensions of people’s living conditions were consequently supplemented with micro-data collected on people’s perceptions of quality of life, also called ‘subjective well-being’. Hence, data on subjective well-being were collected for the first time across all EU Member States with the quality standards of official statistics.
Micro-data on objective and subjective measures were checked and analysed. Indicators from the quality of life framework were computed and analysed together with different elements affecting quality of life, such as for instance educational level, activity and health status as well as family and financial situation. The results of these analyses are presented in this flagship publication.
Figures 2, 3 and 4 show the different pictures that can be obtained when complementing the GDP with an objective indicator on households’ income (Figure 2), the subjective perception of people’s financial situation (Figure 3) and the subjective multidimensional indicator on people’s life satisfaction (Figure 4). This illustrates the need for complementing the GDP to monitor social progress, since analysing the GDP alone (Figure 1) leads to somewhat different conclusions than analysing it in connection with these additional indicators.
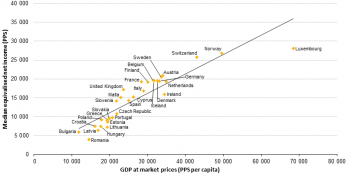
Source: Eurostat (nama_10_pc) and (ilc_di03)
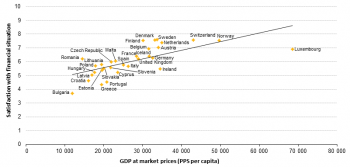
Source: Eurostat (nama_10_pc) and (ilc_pw01)
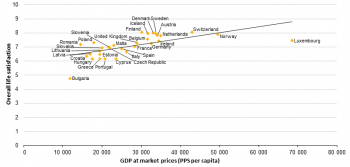
Source: Eurostat (nama_10_pc) and (ilc_pw01)
What can you find in this publication?
Quality of life in Europe — facts and views is divided into nine chapters covering the 8+1 dimensions of the quality of life framework:
- material living conditions;
- productive or main activity (covering employment);
- health;
- education;
- leisure and social interactions;
- economic and physical safety;
- governance and basic rights;
- natural and living environment; and
- overall life satisfaction.
The emphasis in this publication has been placed on the data collected under the 2013 ad-hoc module on subjective well-being, which was added to the statistics on income and living conditions (EU-SILC). Nevertheless, the annual EU-SILC data and indicators coming from other sources within the European Statistical System (ESS), in particular the EU Labour Force Survey (EU-LFS), complement the picture.
As people’s life satisfaction cannot be reduced to one single aspect, this publication presents the different aspects of quality of life, combining objective indicators with the subjective evaluation of individuals’ situations. The subjective indicators available for each dimension are analysed taking into consideration different socio-economic factors such as age, sex, labour status, etc. while their impact on self-assessed satisfaction levels are evaluated. Then the relationship between the subjective perceptions and the objective measurements belonging to the same domain are studied. Nevertheless, the dimensions are often interlinked and multi-causality appears. This publication touches on the issue but does not examine it in details. This offers the potential for further research on the topic.
Please note that in the graphs presented in these articles, some totals may not correspond with the sum of the separate figures, due to rounding.
Aggregated source data, tables and graphs are available in Excel format through the Statistics Explained platform.
Infographic associated to this 'Quality of life' publication
To complement this publication on quality of life, Eurostat has recently developed an infographic that provides information on people’s well-being in a simple way. For each dimension of the quality of life framework the infographic shows an indicator of people’s subjective evaluation complemented with an objective indicator. The infographic can be accessed through the homepage of Eurostat’s website.
