Economic developments in European Neighbourhood East countries
Data extracted in February 2024.
Planned article update: March 2025.
Highlights
GDP per capita in the European Neighbourhood Policy-East countries was between 10.5 % and 20.9 % of that in the EU in 2022.
Moldova had the lowest economic activity rate among the European Neighbourhood Policy-East countries in 2022, with only 53.7 % of the population aged 20 to 64 years either in employment or unemployed and available for work.
Most of the employment in the European Neighbourhood Policy-East countries, as in the EU, is in the 'Services' sector. In 2022, this sector's share of employment ranged from 48.8 % in Azerbaijan to 61.8 % in Georgia. In the EU, the 'Services' sector accounted for 71.5 % of employment.
In 2022, in all three European Neighbourhood Policy-East countries for which data are available, Armenia, Georgia and Moldova, imports of goods were higher than exports while exports of services exceeded imports.
This article is part of an online publication. It presents statistics on recent economic developments for five European Neighbourhood Policy-East (ENP-East) countries, namely, Armenia, Azerbaijan, Georgia, Moldova and Ukraine, comparing them with development in the European Union (EU). Georgia, Moldova and Ukraine are also candidate countries, the European Council having granted Moldova and Ukraine candidate status on 22 June 2022 and Georgia on 14 December 2023. This article does not contain any data on Belarus, as statistical cooperation with Belarus has been suspended as of March 2022.
Data shown for Georgia exclude the regions of Abkhazia and South Ossetia over which the government of Georgia does not exercise control. The data managed by the National Bureau of Statistics of the Republic of Moldova does not include data from the Transnistrian region over which the government of the Republic of Moldova does not exercise control. Since 2014, data for Ukraine generally exclude the illegally annexed Autonomous Republic of Crimea and the City of Sevastopol and the territories which are not under control of the Ukrainian government. Data on Ukraine for the year 2022 is limited due to exemption under the martial law from mandatory data submission to the State Statistics Service of Ukraine, effective as of 3 March 2022, following Russia's war of aggression against Ukraine.
This article presents, among others: statistics on gross domestic product (GDP), measured in € and in € per capita; the size of the labour force compared to the total population of working age; the contributions of the respective main (non-financial) economic sectors to total employment and gross value added (GVA); the gross fixed capital formation in these economies; the trade balances of goods and services with the rest of the world from the balance of payments statistics; foreign direct investments (FDI) flows; and the structure of the enterprise sector by the size of the enterprises.
Full article
Gross domestic product (GDP)
Gross domestic product (GDP) is an aggregate measure of the size of an economy, based on its total final output. The ENP-East countries had a combined GDP of €282.9 billion in 2022. In comparison, the GDP of the EU was €15.9 trillion.
In 2022, Ukraine remained the largest economy among the ENP-East countries, despite the beginning of Russia's war of aggression against Ukraine in February 2022. Ukraine's GDP in 2022 was valued at €152.8 billion. Azerbaijan had the second largest economy among the ENP-East countries, with a GDP of €74.6 billion in 2022. The other ENP-East economies were much smaller: Georgia's GDP was €23.3 billion in 2022. The GDP in Armenia was €18.4 billion in 2022, while that of Moldova was valued at €13.8 billion.
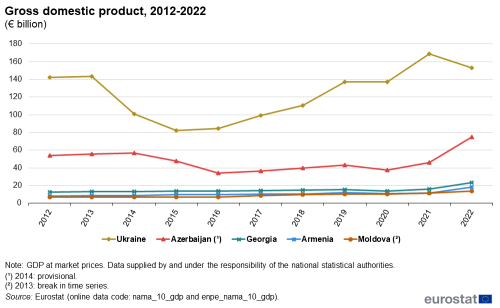
(€ billion)
Source: Eurostat (nama_10_gdp) and (enpe_nama_10_gdp)
Real gross domestic product, also called GDP at constant prices, focuses on the volume of output, ignoring price changes. The calculation of the annual growth rate of GDP at constant prices, in other words the real change in GDP, allows comparison of the dynamics of economic development, both over time and between economies of different sizes, regardless of developments in price levels and exchange rates.
Data on annual change in real GDP are shown in Figure 2 for the period 2018-2022. In 2019, immediately before the Covid-2019 pandemic affected economies, annual real GDP growth was faster in the ENP-East countries than in the EU: 7.6 % in Armenia, 5.0 % in Georgia, 3.6 % in Moldova, 3.2 % in Ukraine and 2.5 % in Azerbaijan, compared with a real GDP growth of 1.8 % in the EU.
The year 2020 marked the start of the economic impact of the Covid-19 pandemic. All ENP-East countries and the EU recorded a decline in real GDP in that year. Among the ENP-East countries, the largest fall was in Moldova at -8.3 %, followed by Armenia at -7.2 % and Georgia at -6.8 %, all larger than the -5.6 % decline in the EU. In 2020, real GDP fell at a slightly lower rate than in the EU in Azerbaijan, at -4.2 %, and in Ukraine, at -3.8 %.
Although the Covid-19 pandemic continued into 2021, the economies of the ENP- East countries and the EU rebounded strongly. Generally, the countries that suffered the largest economic impact in 2020 also showed the greatest recovery in 2021, with most recording stronger real GDP growth in 2021 than the corresponding contraction in 2020. Moldova's real GDP growth in 2021 was 13.9 %, Georgia's 10.5 % and Azerbaijan's 5.6 %, all greater than the decline in 2020. The exceptions were Armenia, where the 5.8 % real GDP growth in 2021 fell 1.4 percentage points (pp) short of compensating the decline in 2020, and Ukraine with 3.4 % (0.4 pp less than the corresponding fall in 2020).
In 2022, the beginning of Russia's war of aggression against Ukraine had a significant effect on Ukraine's economy, with real GDP falling sharply by -29.1 %. Neighbouring Moldova also experienced a substantial fall in real GDP, by -5.0 %. In contrast, real GDP continued to increase strongly in Armenia and Georgia, by 12.6 % and 10.1 % respectively, while real GDP growth was more moderate in Azerbaijan, with an increase of 4.6 %.
In 2022, real GDP grew by 3.5 % in the EU, 2.5 pp lower than the previous year.
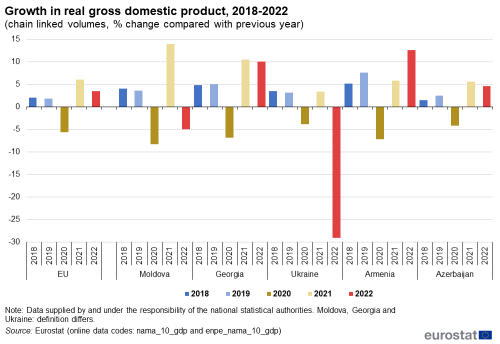
(chain linked volumes, % change compared with previous year)
Source: Eurostat (nama_10_gdp) and (enpe_nama_10_gdp)
Analysis of GDP per capita (per person) removes the influence of the population size, making comparisons between different countries easier. As a result, GDP per capita is a broad economic indicator that may be used for a basic analysis of living standards.
However, the global supply chain crisis following the Covid-19 pandemic [1] and the effects on world market prices of Russia's war of aggression against Ukraine affected inflation rates across the world, which was reflected in sharp increases in GDP measured in current prices in particular in 2022 (see Figure 1 above).The exception was Ukraine, where GDP in current prices fell less steeply than the real GDP measured in constant prices (chain-linked volumes, see Figure 2 above), following the beginning of Russia's war of aggression against Ukraine.
As shown in Table 1, in 2022 GDP per capita increased, both for the EU and in the ENP-East countries, with Ukraine the only exception. In 2022, the highest GDP per capita among the ENP-East countries was recorded in Azerbaijan, at around €7 400 per capita. In Georgia, GDP was measured at €6 300 per capita, in Armenia at €6 200 per capita, and in Moldova at €5 400 per capita. In Ukraine, it is estimated that the GDP per capita decreased to €3 700 in 2022.
Differences in GDP per capita between the ENP-East countries increased from 2021 to 2022, but were still relatively similar to each other compared with the differences in GDP per capita between the EU countries. GDP per capita in the EU averaged €35 400 in 2022, which was five to ten times higher than in the ENP-East countries.
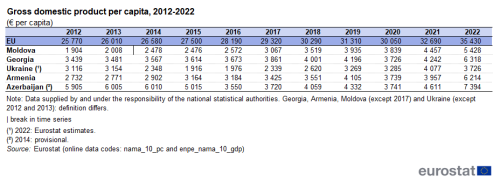
(€ per capita)
Source: Eurostat (nama_10_pc) and (enpe_nama_10_gdp)
Labour force
The labour force consists of the economically active population. It includes both employed and unemployed people, while the economically inactive population is composed, among others, of students, pensioners, people caring for other family members and those who are unable to work because of long-term sickness or disability. Only the working-age population (20 to 64 years) is considered in the data analysed. A high rate between the labour force and the whole population is considered a pillar to build a stable economy.
Figure 3 shows that, among the ENP-East countries, Azerbaijan has an activity rate very similar to the EU average (79.4 %), with its labour force corresponding to 79.8 % of the population aged 20 to 64 in 2022. Ukraine, at 71.9 % (2021 data), Armenia at 67.9 % and Georgia at 65.9 % had a slightly lower rate. Moldova recorded the lowest activity among the ENP-East countries in 2022, at 53.7 %.
In Azerbaijan, the rate of economically active population aged 20 to 64 years increased by 3.8 pp from 2012 to 2022, with a slight year-on-year increase in most years. In Ukraine, there was a minor decrease of -0.6 pp over the period 2012-2021, with a notable fall of 2.2 pp in 2014. 2022 data are not available for Ukraine, thus the data do not reflect the effects on the labour force as a result of Russia's war of aggression against Ukraine. Armenia recorded the highest fluctuations among the ENP-East countries over 2012-2022, with the activity rate ranging from 62.7 % in 2019 to 72.2 % in 2013. Over the period as a whole, the activity rate decreased by 5.5 pp. However, a methodological break in the time series appears to coincide with a shift in the level of the rate. Although the activity rate in Georgia appears to be substantially lower in 2022 than in 2012, this was largely due to an important methodological change in 2020, with a change in methodology from the ILO standards adopted at the 13th International Conference of Labour Statisticians (ICLS) to the new standards adopted at the 19th ICLS, This led to a shift in the level of the activity rate, with the rate 11.3 pp lower in 2020 (63.2 %) than the previous year (74.5 %). Consequently, data for 2020 and subsequent reference years should not be directly compared to data for previous years for Georgia. Moldova had by far the lowest economic activity rate among the ENP-East countries over the period, ranging from 49.5 % in 2012 to 54.9 % in 2018. In 2022, the activity rate was 8.6 pp higher than 2012. However, methodological changes in 2014 and 2019 makes it difficult to compare the data over time. In 2014, the definition of the population changed to the usual resident population. Since 2019, a new sampling plan and a revised definition of employment have been applied for the labour force survey.
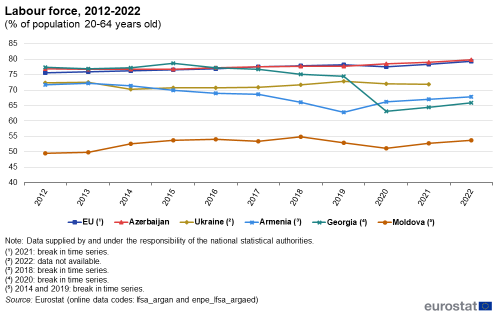
(% of population aged 20-64 years)
Source: Eurostat (lfsa_argan) and (enpe_lfsa_argaed)
Employment and gross value added by sector
The structure of an economy can be studied based on of the contributions of key sectors to total gross value added (GVA) and total employment. GVA is the value that producers have added to the goods and services they have bought, and is used as an economic productivity metric. The share of total employment is for this analysis defined as employment among the population aged 15 and over. A comparison between a sector's share of total GVA and its corresponding share of total employment in the non-financial economy gives insights into the labour productivity of the sector relative to the whole economy. When a sector's share of total GVA in the economy is higher than its corresponding share of total employment, the sector can be considered to have a higher labour productivity than the (non-financial) economy as a whole.
Data are shown in Figure 4. They all refer to 2022, except employment in Ukraine, which refers to 2021.
Most of the employment in the non-financial economy in the ENP-East countries is found in the 'Services' sector. In 2022, this sector's share of employment ranged from 48.8 % in Azerbaijan to 61.8 % in Georgia. Its share of total GVA ranged from 60.8 % in Armenia to 68.9 % in Ukraine, except in Azerbaijan (34.5 %). Thus, the 'Services' sector had higher labour productivity than the average for the economy in all of these countries (except Azerbaijan), with the 'Services' sector's shares of GVA between 4.9 pp (Armenia) and 11.1 pp (Moldova) higher than the corresponding shares of employment. However, in Azerbaijan the 'Services' sector's share of GVA was lower than its share of employment, at -14.3 pp. The 'Services' sector accounted for the largest share of both total employment (71.5 %) and total GVA (71.9 %) also in the EU in 2022. The corresponding labour productivity was only 0.4 pp higher than for the whole non-financial economy in the EU. Considering the high shares of the 'Services' sector in the EU with respect both to overall employment and GVA, making up close to three quarters of both totals, it is not surprising that there was only a minor difference in labour productivity between this sector and the overall economy.
The economy of Azerbaijan is highly dependent on the production and export of oil and natural gas. In 2022, more than half (55.2 %) of its GVA was produced by the 'Industry' sector, reflecting the substantial GVA generated by the petroleum extraction and processing activities. In contrast, the employment in the sector represented only 7.0 % of the total, as the petroleum activities are capital intensive rather than labour intensive. Thus, the labour productivity of the 'Industry' sector was 47.5 pp higher than the overall labour productivity in the economy. The high share of the 'Industry' sector in total GVA by definition yielded lower shares for the other main sectors, thus generating lower calculated labour productivity in the other three main sectors in Azerbaijan: 'Agriculture, forestry and fisheries' -30.7 pp; 'Services' -14.3 pp; Construction -2.5 pp.
In the other ENP-East countries, the share of GVA generated by the 'Industry' sector ranged from 14.3 % of total GVA in Moldova to 20.4 % in Ukraine, while the sector's share of employment in 2022 ranged from 11.9 % of total employment in the non-financial economy in Georgia to 18.2 % in Ukraine (2021 data). Compared to the overall non-financial economy, the labour productivity of the 'Industry' sector was lower in Moldova, at -0.5 pp, and higher in Ukraine (2.2 pp), Georgia (4.8 pp) and Armenia (7.0 pp). In the EU, the 'Industry' sector accounted for 20.6 % of total GVA and 17.7 % of total employment in 2022, with the corresponding labour productivity 2.9 pp higher than for the overall non-financial economy.
In all ENP-East countries, the 'Agriculture, forestry and fisheries' sector played a more important role for employment than for GVA, with this sector's share of employment, ranging from 14.1 % in Ukraine (2021 data) to 22.2 % in Armenia. Azerbaijan was an outlier with 35.8 % of employment accounted for by the 'Agriculture, forestry and fisheries' sector. In comparison, this sector accounted for only 3.7 % of employment in the EU in 2022. In all these countries, the share of GVA was lower, ranging from 5.1 % in Azerbaijan to 11.4 % in Armenia. In comparison, in the EU the 'Agriculture, forestry and fisheries' sector's share of GVA was 1.9 %. Thus, the sector's labour productivity was 30.7 pp lower than that of the overall economy in Azerbaijan. The sector's labour productivity was around 10 pp lower than the overall economy in Moldova (-11.2 pp), Georgia (-10.9 pp) and Armenia (-10.8 pp). The difference was smaller in Ukraine (-4.8 pp) and in the EU (-1.8 pp).
Concerning the 'Construction' sector, in general there were no large differences between the sector's share of total employment and GVA in any of the countries except Ukraine. Whereas the 'Construction' sector's share of total employment ranged from 7.0 % in Ukraine (2021 data) to 8.5 % in Armenia and Georgia, the share of total GVA ranged from 5.2 % in Azerbaijan to 8.2 % in Moldova, with Ukraine being an outlier at just 1.4 % of total GVA. However, the most recent available data on employment (7.0 %) is for reference year 2021, i.e. before the beginning of Russia's war of aggression against Ukraine in 2022, while the GVA data (1.4 %) is for year 2022. In 2021, the 'Construction' sector accounted for 3.2 % of total GVA in Ukraine. Compared with the overall labour productivity of the economy, in 2022 the labour productivity of the 'Construction' sector was lower in Azerbaijan (-2.5 pp), Armenia (-1.0 pp), and Georgia (-0.5 pp), and slightly higher in Moldova (0.5 pp). In Ukraine, the difference between the shares of GVA in 2022 and the share of employment in 2021 was -5.6 pp; when comparing data for both employment and GVA for 2021, the difference was -3.8 pp. The importance of the 'Construction' sector for total employment and GVA in the EU was not dissimilar to that in the ENP-East countries (other than Ukraine), with shares of employment at 6.7 % and of GVA at 5.5 % and labour productivity -1.2 pp lower than for the overall (non-financial) economy in 2022.
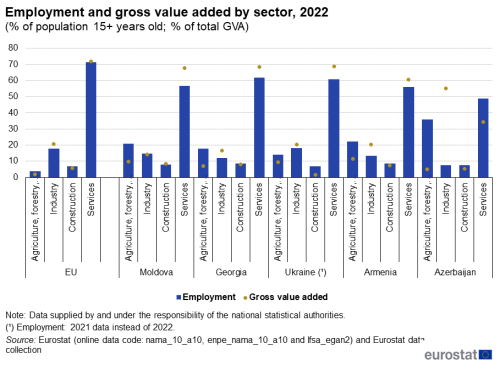
(% of population aged over 15 years; % of total GVA)
Source: Eurostat (nama_10_a10), (enpe_nama_10), (lfsa_egan2) and Eurostat data collection.
Gross fixed capital formation
Gross fixed capital formation (GFCF) indicates how much of the value added in an economy is invested rather than consumed. It is considered an indicator of future business activity. In general, GFCF tends to increase in times of economic growth and business confidence. Conversely, it tends to decrease in case of economic uncertainty or recession.
GFCF as a percentage of GDP in the period 2012 to 2022 is presented in Figure 5 for the ENP-East countries, compared to the EU. At the beginning of the period, in 2012, this percentage was very similar in all ENP-East countries, ranging from 19.4 % in Ukraine to 23.6 % in Moldova and Armenia, with Georgia (22.1 %) and Azerbaijan (22.4 %) also falling within this range. The average EU percentage was 20.3 % in 2012.
Some fluctuations were observed within the period. In most cases, years and periods of decrease appear to coincide with local political events and conflicts. In Moldova and Georgia, the ratio between GFCF and GDP was quite stable in the observed period, above 20 %, with 2013 in Georgia (18.6 %) as the only exception.
In Armenia there was a gradual decrease in the GFCF, from 23.6 % in 2012 to 15.8 % in 2019, followed by a recovery to 20.3 % in 2022. In Azerbaijan, increases were observed between 2012 (22.4 %) and 2015 (27.8 %), followed by mainly downward fluctuations and a sharp decrease in the last two years, falling to 12.9 % in 2022.
In Ukraine, the ratio between GFCF and GDP was constantly at a lower level compared to the other ENP-East countries, with the exception of the 2018 and 2019 ratios in Armenia. The GFCF-to-GDP ratio decreased from 19.4 % in 2012 to 13.5 % in 2015. In 2018, it increased somewhat, to 17.7 %, only to decrease again to reach 11.6 % in 2022.
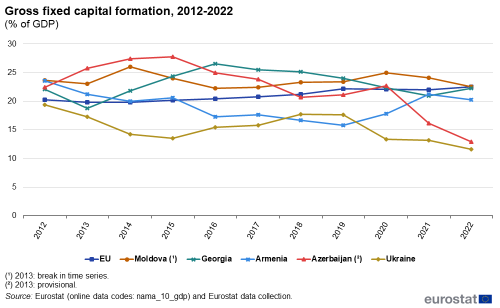
(% of GDP)
Source: Eurostat (nama_10_gdp) and Eurostat data collection.
External balance of goods and services
The external balance of goods and services is the difference between exports and imports of goods and services. This balance is important for sustainable GDP growth. Measured as a share of GDP, it is also an expression of the openness of the economy and its dependence on international trade. Figure 6 presents the external balance of goods and services in the ENP-East countries for the years 2017 and 2022. Data for Ukraine and Azerbaijan are not available.
In 2022, in all ENP-East countries for which data are available, the balances for services were positive, i.e., the value of exports of services was higher than that of imports. The balances for goods, however, were negative, meaning total exports were lower than total imports. Similarly for 2022, the deficit was unchanged whereby the overall balances for goods remained negative and the overall balances for services remained positive.
In Moldova, the imbalances increased slightly between 2017 and 2022. The deficit in trade of goods increased from -26.7 % of GDP in 2017 to -34.5 % in 2022, while the surplus for trade in services grew from 3.2 % to 6.3 % over the same period. In Armenia, there were positive developments in the trade balances both for goods and for services over this period. The negative balance in trade of goods improved from -12.1 % of GDP in 2017 to -9.5 % in 2022, while the trade balance for services strengthened from 1.3 % to 8.5 %. In Georgia, the deficit in trade of goods fell from -23.4 % to -20.7 %, while the surplus for services also shrunk somewhat from 12.5 % to 10.5 %. In all cases the deficits in external trade of goods were significantly higher than the corresponding surpluses in external trade of services both in 2017 and in 2022.
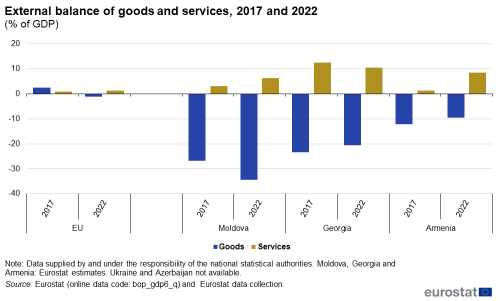
(% of GDP)
Source: Eurostat (bop_gdp6_q) and Eurostat data collection.
Foreign direct investment balance
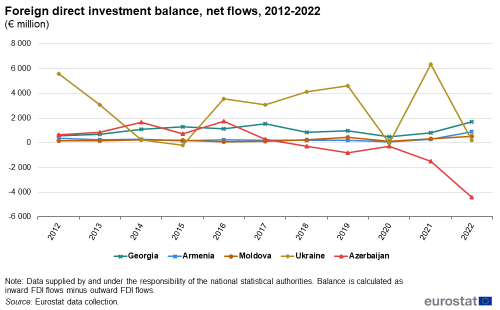
Foreign direct investment (FDI) represents a lasting interest in an enterprise operating in another economy and implies the existence of a long-term relationship between the direct investor and the recipient enterprise. It forms a part of the financial account of the balance of payments. Inflows represent flows of investment into the economy; outflows represent flows of investment by the economy to the rest of the world. Negative values represent a reduction in the value of FDI in the economy; this may reflect transfer of ownership from foreign to domestic investors, revaluation of investments or other disinvestment. Countries that attract considerable inward investment are often themselves investors in other countries. The balance of inward and outward FDI flows is shown in Figure 7. As FDI may reflect large investments in specific projects within a limited timeframe, data values can vary greatly from one year to another.
Over the period 2012-2022, Ukraine was by far the ENP-East country with the most net FDI flows into the economy, also reflecting its status as the largest economy among these countries. However, the net balance of FDI flows fluctuated considerably, with sharp falls in net FDI flows in 2014 (to €226.1 million) and 2015 (to -€212.8 million), around the time of Russia's illegal annexation of the Autonomous Republic of Crimea and the City of Sevastopol and loss of control by the Ukrainian government of territories in the east of the country. Further sharp falls to low values were recorded in 2020, in connection with the Covid-19 pandemic, and in 2022 following Russia's war of aggression against Ukraine. In the other years of the reference period, the net balance of FDI flows was positive, with highs in 2012 at €5 598.1 million and 2021 at €6 351.5 million.
Until 2017, Azerbaijan used to have a positive net balance of FDI flows, with highs of €1 670.9 million in 2014 and €1 740.8 million in 2016. Thereafter, the balance began to fall, becoming negative in 2018 and reaching a low at -€4 408 millions in 2022. Georgia, Armenia and Moldova had less scattered trends between 2012 and 2022, with a positive balance in their FDI flows throughout the period.
Persons employed by enterprise size
The non-financial business economy includes the sectors industry, construction, distributive trades and services. The analysis of its employment, broken down by enterprise size, is presented in Figure 8. Data refers to 2022, except for Moldova and Ukraine (2021 data). Data for Azerbaijan are not available.
Large enterprises are defined as enterprises with 250 or more persons employed; medium-sized enterprises with 50 to 249 persons employed; small enterprises with 10 to 49 persons employed; and micro enterprises with less than 10 persons employed.
In 2022, large enterprises and micro enterprises together accounted for two thirds of employment in the non-financial business economy in the EU: large enterprises accounted for 35.9 %, micro enterprises for 29.7 %. Persons employed in small enterprises made up 18.8 % of the total and those in medium-sized enterprises 15.6 %.
The structure of employment in the non-financial business in Ukraine was quite similar to that in the EU, with almost three quarters of persons employed in large enterprises (35.7 %) and micro enterprises (36.5 %) and smaller shares in small (14.4 %) and medium sized (13.5 %) enterprises (2021 data). The same applied to a certain extent to Armenia, where large enterprises (30.5 %) and micro enterprises (28.0 %) employed the largest shares of the work force, with more moderate shares for small enterprises (21.8 %) and medium-sized enterprises (19.7 %).
In Georgia, large enterprises accounted for 38.1 % of the persons employed, with around one fifth of the total in each of the other size categories (micro enterprises 21.2 %; small enterprises 20.4 %; medium-sized enterprises 20.3 %). In Moldova, the structure was more even across the four sizes of enterprises, with around one quarter of the persons employed in each: micro enterprises 21.5 %; small enterprises 25.2 %; medium-sized enterprises 24.4 %; and large enterprises 28.9 %.
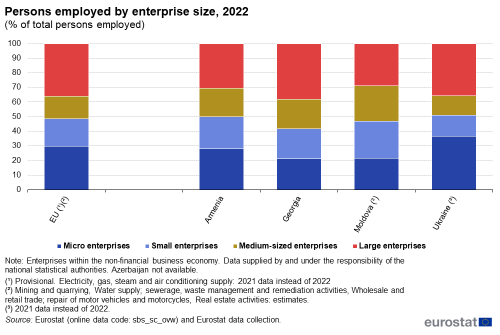
(% of total persons employed)
Source: Eurostat (sbs_sc_ovw) and Eurostat data collection.
Source data for tables and graphs
Data sources
The data for ENP-East countries are supplied by and under the responsibility of the national statistical authorities of each country on a voluntary basis. The data result from an annual data collection cycle that has been established by Eurostat. These statistics are available free-of-charge on Eurostat’s website, together with a range of additional indicators for ENP-East countries covering most socio-economic topics.
The European system of national and regional accounts (ESA) provides the methodology for national accounts in the EU. The national accounts data presented in this article for ENP-East countries were generally collected under the international System of national accounts (SNA) standard. The structure of ESA 2010 is consistent with the international guidelines on national accounting set out in 2008 SNA.
GDP is the central measure of national accounts, which summarises the economic position of a country (or region). It can be calculated using different approaches: the output approach; the expenditure approach; and the income approach. The main aggregates of national accounts are compiled from institutional units, namely non-financial or financial corporations, general government, households, and non-profit institutions serving households (NPISH).
Context
Indicators derived from national accounts provide a picture of the economic situation; they are widely used for analysis and forecasting, as well as policymaking. The 2008-2009 global financial and economic crisis reinforced the need to develop more robust national accounts in order to improve the surveillance and monitoring of financial systems and the impact that the crisis may have on economies, while also providing additional valuable information to support economic initiatives geared towards recovery. The use of internationally accepted concepts and definitions permits analysis of different economies, such as the interdependencies between the economies of the EU Member States, or a comparison between the EU and non-member countries. On 2 July 2021, the European Commission and the EU High Representative for Foreign Affairs and Security Policy presented the Eastern Partnership: a Renewed Agenda for cooperation with the EU's Eastern partners. This agenda is based on the five long-term objectives, with resilience at its core, as defined for the future of the Eastern Partnership (EaP) in the Joint Communication Eastern Partnership policy beyond 2020: Reinforcing Resilience – an Eastern Partnership that delivers for all in March 2020. It is further elaborated in the Joint Staff Working Document Recovery, resilience and reform: post 2020 Eastern Partnership priorities, amongst others defining the 'Top Ten Targets for 2025'. The Eastern Partnership’s agenda for recovery, resilience and reform is underpinned by an 'Economic and Investment Plan for the Eastern Partnership (EaP): Investing in resilient and competitive economies and societies' (Annex I of the Joint Staff Working Document). More detailed overviews are given in a Factsheet on the Eastern Partnership Joint Communication, presenting the policy objectives and the specific priorities, as well as in a Factsheet on EU-Eastern Neighbourhood flagship projects 2023-2024.
The Joint Declaration of the Eastern Partnership Summit 'Recovery, Resilience and Reform' of 15 December 2021 reaffirmed the strong commitment to a strategic, ambitious and forward-looking Eastern Partnership.
At the Eastern Partnership Foreign Affairs Ministerial meeting of 11 December 2023, the EU, member states and partners declared that they will step up their efforts to implement the Eastern Partnership’s agenda for recovery, resilience and reform, as well as tackling challenges related to the ongoing consequences of the Russian war of aggression against Ukraine for the entire region.
In cooperation with its ENP partners, Eurostat has the responsibility 'to promote and implement the use of European and internationally recognised standards and methodology for the production of statistics, necessary for designing and monitoring policies in various areas. Eurostat manages and coordinates EU efforts to increase the capacity of the ENP countries to develop, produce and disseminate good quality data according to European and international standards. Additional information on the policy context of the ENP is provided on the website of Directorate-General European Neighbourhood Policy and Enlargement Negotiations (NEAR).
Direct access to
- All articles on non-EU countries
- European Neighbourhood Policy countries — statistical overview — online publication
- Statistical cooperation — online publication
Books
Factsheets
- Basic figures on the European Neighbourhood Policy-East countries — 2023 edition
- Basic figures on the European Neighbourhood Policy-East countries — 2022 edition
- Basic figures on the European Neighbourhood Policy-East countries — 2021 edition
Leaflets
- Basic figures on the European Neighbourhood Policy — East countries — 2020 edition
- Economic statistics for the European Neighbourhood Policy-East countries — 2020 edition
- Basic figures on the European Neighbourhood Policy — East countries — 2019 edition
- Basic figures on the European Neighbourhood Policy — East countries — 2018 edition
- Basic figures on the European Neighbourhood Policy — East countries — 2016 edition
- International trade for the European Neighbourhood Policy — East countries — 2016 edition
- Basic figures on the European Neighbourhood Policy — East countries — 2015 edition
- Basic figures on the European Neighbourhood Policy — East countries — 2014 edition
- European Neighbourhood Policy — East countries — Key economic statistics — 2014 edition
- Economy and finance (enpe_ecf)
- National accounts (enpe_na)
- GDP, main aggregates and economic indicators (enpe_nama_gdp)
- Gross value added by industry (enpe_nama_a10)
- Balance of payments (enpe_bop)
- Balance of payments (enpe_bop_c6_a)
- National accounts (enpe_na)
- Main GDP aggregates (nama_10_ma)
- Balance of payments - International transactions (BPM6) (bop_6)
- Balance of payments statistics and international investment positions (BPM6) (bop_q6)
- European Union and euro area balance of payments - quarterly data (BPM6) (bop_eu6_q)
- Balance of payments statistics and international investment positions (BPM6) (bop_q6)
- European Union direct investments (bop_fdi)
- EU direct investment flows, breakdown by partner country and economic activity (NACE Rev. 2) (bop_fdi_flow_r2)
- Eastern European Neighbourhood Policy countries (ENP-East) (ESMS metadata file — enpe_esms)
- European External Action Service (EEAS): European Neighbourhood Policy (ENP) and Eastern Partnership (EaP)
- Directorate-General European Neighbourhood Policy and Enlargement Negotiations (DG NEAR): European Neighbourhood Policy (ENP) and Eastern Partnership (EaP)
- Joint Communication JOIN(2020) 7 final: Eastern Partnership policy beyond 2020: Reinforcing Resilience - an Eastern Partnership that delivers for all (18 March 2020)
- Joint Staff Working Document SWD(2021) 186 final: Recovery, resilience and reform: post 2020 Eastern Partnership priorities (2 July 2021)
- Joint Declaration of the Eastern Partnership Summit: 'Recovery, Resilience and Reform' (15 December 2021)
Notes
- ↑ OECD (2021), "Global value chains: Efficiency and risks in the context of COVID-19", OECD Policy Responses to Coronavirus (COVID-19), OECD Publishing, Paris
