Archive:Intellectual property rights statistics

Source: Eurostat (ipr_ta_tot)
Source: Eurostat (ipr_ta_tot) (ipr_ta_gdp) (ipr_ta_pop)


- Data extracted in June 2014. Most recent data: Further Eurostat information, Main tables and Database
This article presents statistics on two types of Intellectual Property Rights (IPR): Community Trademarks (CTM) and Design applications (CD) in the European Union (EU). Data are published by Eurostat based on raw data received from the Office for Harmonization in the Internal Market (OHIM), which is the European Union agency for the registration of Community trademarks and designs.
Intellectual property refers broadly to the creations of the human mind. Common types of intellectual property rights include patents, trademarks, industrial designs and copyrights. They constitute means by which creators seek protection for their intellectual property. Trademarks and designs reflect non-technological innovation in every sector of economic life, including services. In this context, indicators based on trademark and design data can provide a link between non-technological innovation and the market. R&D and patents are mainly related to the measurement of technological innovation and scientific expertise.
Main statistical findings
Community trademark applications
More than 80 000 CTM applications originating from EU-28 Member States were received by OHIM in 2013 for the protection of trademarks in the EU. During the period 2009-2013 there has been an increasing trend in the total number of CTM applications at EU-28 and worldwide level (see Figure 1), after a small decrease between 2007 and 2008.
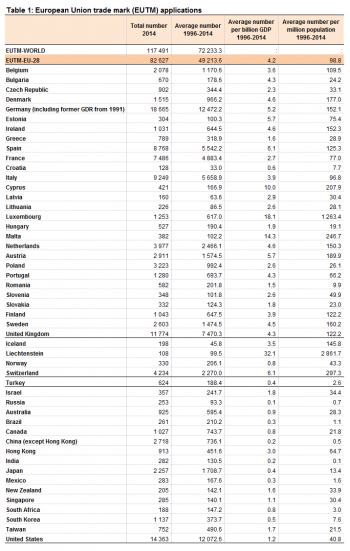
Among the EU-28 Member States, Germany and the United Kingdom had the highest number of CTM applications in 2013 (see Table 1). These two countries account for almost 40% of total applications received by OHIM in 2013 from EU-28 Member States. Based on the average number of trade mark applications during the period 1996-2013, the leading European countries in CTM protection were Germany, the United Kingdom, Italy, Spain, France, the Netherlands and Switzerland. The United States and Japan were the non-European countries with the highest number of CTM applications to OHIM for the protection of trademarks. Among non-European countries, the United States has the highest average number of CTM applications between 1996 and 2013, at almost 11 950. During 2013 OHIM received 14 849 applications originating from the United States for the protection of trademarks throughout the EU.
CTM applications can be expressed in relation to Gross Domestic Product (GDP) or population (see Table 1) in order to improve comparability. These ratios lead to different conclusions than those derived when only total counts are used. The relative figures were calculated for the period 1996-2013 as the ratios of the average number of CTM applications in relation to the average GDP or average population. Figures per GDP show that countries with smaller economies in terms of absolute values of GDP, like Liechtenstein (LI), Luxembourg (LU), Malta (MT) and Cyprus (CY), have the highest activity in seeking protection for community trademarks when looking at CTM applications per GDP. According to the relative figures for CTM applications per population, Liechtenstein, Luxembourg, Switzerland and Cyprus report the highest number of CTM applications per million inhabitants.
The high figures on CTM applications per GDP and population for specific countries constituted the motive for further investigation of the situation in IPR protection. The analysis indicates that a set of countries do provide an attractive environment in terms of corporate taxation for the protection of intellectual property. Furthermore, the analysis shows that beneficial tax regimes for IPR protection do exist in countries like Cyprus, Malta, Liechtenstein and Luxemburg. The review of available literature verifies the fact that corporations do benefit from fiscal policies provided in specific countries with low corporate taxes and provision of tax exceptions in IPR protection. The flexibility to benefit from the tax policies of foreign countries is provided by the fact that the protection of intellectual property does not have a clear geographical location.
An extended analysis for the role of IPR tax regimes in the protection of intellectual property rights for corporations is available in the paper “Community Trade mark & Design Applications, High figures for particular countries per GDP and Population - The role of provided motivations on IPR protection”.
At EU level, the number of CTM applications to OHIM increased by 5% between 2012 and 2013. Between 2012 and 2013, the protection activity increased for 39 out of 49 countries (80% of total countries). Thirteen countries of which eight are EU-28 Member States, one is EU-28 candidate and four are non EU-28 countries, increased in 2013 more than 20% their total number of CTM applications to OHIM for the protection of trademarks. The leading countries in terms of the annual growth rate in CTM applications between 2012 and 2013 were: Iceland (232%), Croatia (198%), Greece (58%), Malta (37%), Slovenia (29%), Poland (28%), Hungary (27%), Ireland (27%) and Lithuania (23%) (see Figure 2). The most significant decrease in the total number of CTM applications to OHIM between 2012 and 2013 was observed for Russia (12%), India (14%) and Romania (20%).
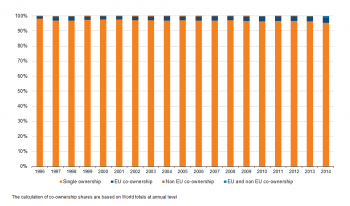
An analysis of co-ownership of Community trademark applications shows that more than 96% of the total CTM applications received by OHIM at annual level belong to a single owner (see Figure 3). Cooperation between EU owners only is very limited and accounts on average for 2.5% of CTM applications received by OHIM between 1996 and 2013.
Community design (CD) filed in applications
In 2013, the total number of designs (see definition under "Context") filed in design applications by EU-28 applicants was equal to 60 541. During 2003-2007 the total number of designs at EU-28 and worldwide level was increasing steadily (see Figure 4). In 2008 design protection was slightly decreased in relation to 2007, till 2009 where the total number of designs at EU-28 and worldwide level was further decreased. From 2010 a recovery in the protection of Community designs is observed worldwide. The total number of designs reached in 2013 the highest value through the whole time period of 2003-2013 at worldwide level. At EU-28 level the recovery in design protection from 2009 onwards is smoother than that at worldwide level, with design protection reaching and overtaking during 2013 the levels of 2007.
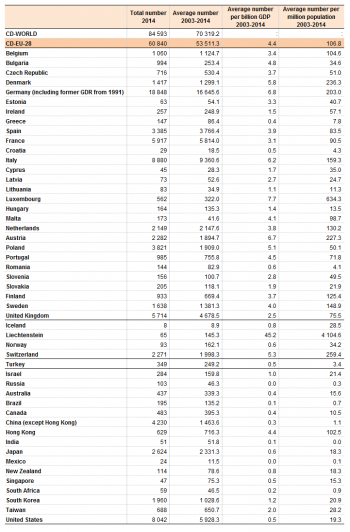
In 2013, Germany was the leading country in design protection with the highest number of designs (18 260) among the EU-28 Member States (see Table 2), followed by Italy with 8 563 designs having being filed in applications. The total number of designs originating from these two countries accounted for 44% of total designs filed in applications that were received by OHIM in 2013 from EU-28 Member States. According to the average number of designs filed during the period 2003-2013, the leading European countries in design protection in European Union were Germany (16 458), Italy (9 419), France (5 858), the United Kingdom (4 590) and Spain (3 801). United States (7 573), China (excl. Hong Kong) (4 008) and Japan (2 564), were the leading non-EU countries in Community design protection during 2013. Among the non-European countries, United States with its average number of Designs reaching almost 5 739 between 2003 and 2013, was the leading non-European country in Community design protection.
Figures on designs filed in applications are also expressed as percentage of GDP and population (see Table 2). Similarly to the case of CTM applications the figures that represent the total number of designs as percentage of GDP or population, lead to different conclusions than those derived when pure totals are used. The relative figures were calculated for the time period of 2003-2013 as the ratios of the average number of designs in relation to the average GDP or average population. When the protection of designs all over Europe is monitored in relation to the size of the economy, similar conclusions with that for trademarks are drawn. Furthermore, the ratio of design applications for Lichtenstein per billion GDP is the highest among all of the 49 countries. However, the leading countries in design protection per GDP are different from those presented for CTM applications, with the exception of Luxembourg. Countries, such as Austria, Italy and Denmark seek protection for a relatively high number of design applications per billion GDP, when compared to other countries. The performance of those countries is similar when total number of designs is expressed per million inhabitants.
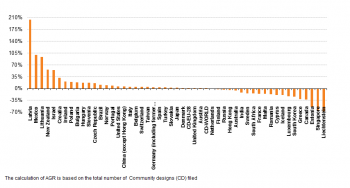
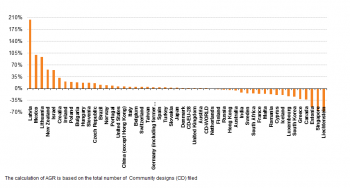
At EU level, the number of designs filed in design applications received by OHIM increased by 2% between 2012 and 2013 (see Figure 5). At worldwide level the increase was higher, reaching 6% for the same time period. Between 2012 and 2013, the protection activity for Community designs increased for 28 out of 49 countries (almost 60% of total countries). Five countries of which four are European countries, have more than 100% increase in the total number of designs that were filed in 2013, when compared to those filed in 2012. These very high annual growth rates occur for countries with a small number of designs. The leading countries in terms of the annual growth rate in Community designs are: Malta (832 %), Singapore (177 %), Bulgaria (165 %), Greece (162 %) and Liechtenstein (134 %). Among the leading European countries in Design protection, United Kingdom increased in 2013 by 14% the total number of Designs filed to OHIM in relation to 2012. Similarly, an increase of 7 % is observed for France. For Italy and Germany the total number of Community designs filed was decreased by 3% and 2% respectively during 2013 compared with 2012. The most significant decrease in the total number of Community designs between 2012 and 2013 among EU-28 Member States was observed for Portugal (20%), Latvia (23%) and the Czech Republic (34%).
An analysis of co-ownership of Community designs shows that almost 80% of the total designs filed in applications that are received by OHIM at annual level belong to a single owner (see Figure 6). Cooperation between EU owners only, is more intensive in the protection of Community designs than in the protection of Community trademarks. The average share of EU co-ownership in Community designs (17%) was higher than that in Community trademarks (2.5%), between 2003 and 2013. EU co-ownership remains stable over the last three years (2011-2013) as almost 15% of Community designs belong to owners originating from EU Member States.
Data sources and availability
The statistical indicators on Community trademarks and designs are produced from the raw data provided by the Office for Harmonization in the Internal Market (OHIM). The Office for Harmonization in the Internal Market (OHIM) is the Agency of the European Union for the registration of Community Trademarks and Designs. Community trademarks and design refer to trade mark and design protections throughout the European Union.
Context
Within the framework of Lisbon Strategy and the objectives of the EU 2020 Strategy, trademark and design statistics can serve as supporting tools for illustrating the achievements reached by the European Union in its strategy for developing a smarter, knowledge based, greener economy, growing fast and sustainably, creating high levels of employment and social progress. The compilation of Statistics on trademarks and designs allows the European Commission to better measure non-technological innovation, which is having an increasing importance for economies that are heavily reliant on the service sector. Trademark and industrial designs constitute protection means that cover all sectors of the economy and allow better measurement of the commercial value of an innovation. Patent and R&D statistics mainly reflect inventions and are less related to the commercialization of a product, as patent or R&D activity might not always lead to a technically successful solution that can be further incorporated in a commercial product or service. Organizational and marketing innovation have already been introduced by Eurostat into the guidelines for collecting and interpreting innovation data (“Oslo Manual”) and by incorporating respective questions into the Community Innovation Survey (CIS 4 and CIS 2012). Non-technological innovations represent first the product innovations that take place in sectors with relatively low technological content, notably the service sector. Trademarks are words or figurative marks that constitute an essential part of the “identity” of goods and services. They help deliver brand recognition, in logos for example, and play an important role in marketing and communication. It is possible to register a variety of trademarks including words, other graphical representations, and even sounds. Rights’ owners have a choice of obtaining protection on a country-by-country basis, or using international systems. A registered Community trademark (CTM) is an exclusive right that protects distinctive signs, valid across the EU, registered directly with OHIM in Alicante in accordance with the conditions specified in the CTM Regulations. A CTM registration lasts for 10 years but can be renewed indefinitely (Source: OHIM). A design is the outward appearance of a product or part of it, resulting from the lines, contours, colours, shape, texture, materials and/or its ornamentation. The design or shape of a product can be synonymous with the branding and image of a company and can become an asset with monetary value that could increase. A registered Community design (CD) is an exclusive right that covers the outward appearance of a product or part of it. A registered Community design is valid in all countries of the European Union. An RCD initially has a life of five years from the filing date and can be renewed in blocks of five years up to a maximum of 25 years. Applicants may market a design for up to 12 months before filing for an RCD without destroying its novelty (Source: OHIM).
See also
- Patent statistics background
- Innovation statistics (online publication)
- Innovation and information society statistics introduced
Further Eurostat information
Publications
- Science, technology and innovation in Europe - Pocketbook, 2013 edition
- Science, technology and innovation in Europe - Pocketbook, 2012 edition
Database
- Science and technology, see:
- Intellectual property rights (ipr)
- Community trade marks (CTM) (ipr_t)
- Community trade mark (CTM) applications by receive year (ipr_ta)
- Community trade mark (CTM) publications by publication year (ipr_tp)
- Community trade mark (CTM) registrations by registration year (ipr_tr)
- Community trade mark (CTM) renewals by receive year (ipr_trn)
- Community trade mark (CTM) lifecycle by receive year (ipr_tl)
- Cooperation for Community trade marks by receive year (ipr_tc)
- Community trade marks (CTM) (ipr_t)
- Community trade marks (CTM) (ipr_t)
- Applications filled for the registration of one or more Community designs (CD) by receive year (ipr_da)
- Community design (CD) filed in applications by receive year (ipr_dfa)
- Registered Community designs (RCD) by registration year (ipr_dr)
- Registered Community design (RCD) publications by publication year (ipr_dp)
- Registered Community designs (RCD) renewals by renewal year (ipr_drn)
- Cooperation for Community designs (CD) by receive year (ipr_dc)
- Community trade marks (CTM) (ipr_t)
Dedicated section
Methodology / Metadata
- Intellectual property rights (ipr) (ESMS metadata file - ipr_esms)
