File:Map1 Entwicklung der regionalen Erwerbslosenquote zwischen 2013 und 2014.png
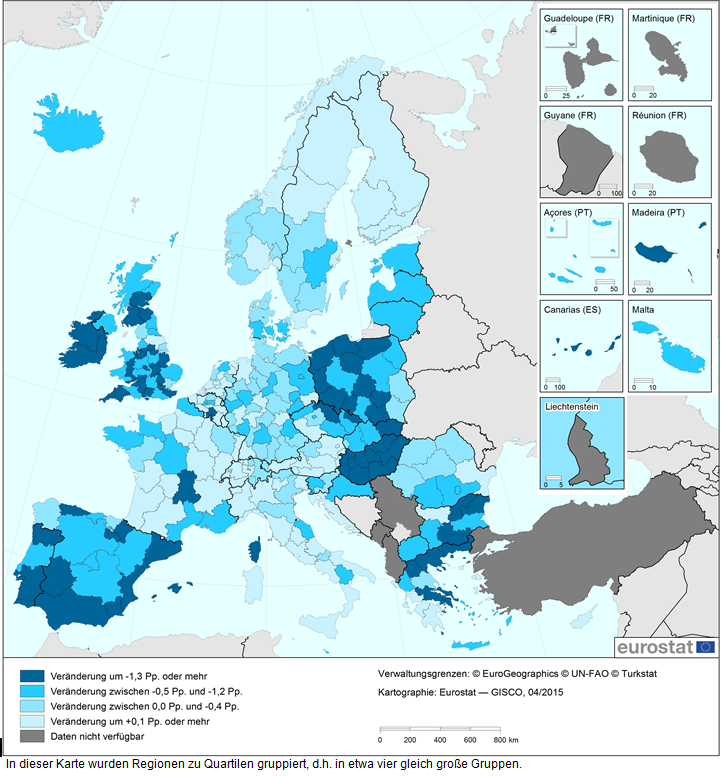
Size of this preview: 557 × 599 pixels. Other resolutions: 223 × 240 pixels | 722 × 777 pixels.
Original file (722 × 777 pixels, file size: 290 KB, MIME type: image/png)
File usage
There are no pages that use this file.