Archive:European cities - demographic challenges
- Data from March 2011. Most recent data: Further Eurostat information, Main tables and Database.
The Treaty of Lisbon states that the European Union (EU) ‘shall work for the sustainable development of Europe’. The EU’s sustainable development strategy[1] aims at ‘continuous improvement of the quality of life and well-being on Earth for present and future generations’. This article presents recent statistical data on the sustainable development of cities, focusing on the demographic aspects.
The data presented were collected by the Urban audit covering more than 300 cities from the EU, plus 26 Turkish, five Croatian, six Norwegian and four Swiss cities. It is complemented with the Large city audit, using a more limited set of variables, for all EU cities with more than 100 000 inhabitants not present in the Urban audit.
Main statistical findings
The European Union needs all regions and cities to contribute for it to achieve its goals. Cities are essential, as they are the home of most work places, businesses and higher education institutions. This statistical article presents a few indicators reflecting some of the challenges cities face, like unemployment, creating and keeping a skilful labour force, air pollution and poverty. The indicators presented are just a few examples, just as these are but a few of the challenges.
Why cities matter
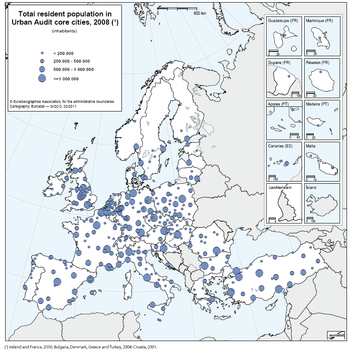
Based on the revised urban–rural typology, 68 % of the EU population live in urban areas. The two most populous cities in the EU are London and Paris. Apart from these two megapolises, Europe features a unique polycentric structure of large, medium and small cities (see Map 1).
Map 1 illustrates the distribution of urban dwellers across cities of different sizes in Europe. Each circle on the map represents an Urban Audit city. At present, the Urban Audit data collection includes more than 300 cities. The size of the circle reflects the number of inhabitants in the core city. Six cities in the Urban Audit have more than 3 million inhabitants: Berlin, Madrid, Paris and London and, in Turkey, Ankara and İstanbul. Another 20 cities have between 1 million and 3 million inhabitants. They are spread all over Europe. There are considerably more smaller cities with between half a million and 1 million inhabitants. There are 80 cities in the next tier, with populations ranging from 250 000 to just under half a million. The total population of all cities in each size category mentioned so far has about the same number of inhabitants, approximately 30 million, underlining the balanced distribution of the urban population in Europe. However, the Urban Audit does not include every city in Europe. Several cities, especially in the smaller size group of fewer than 250 000 inhabitants, are not included.
The urban labour force
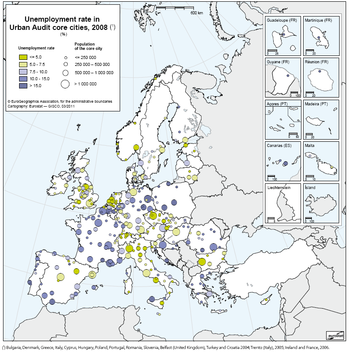
The average unemployment rate across the EU-27 in 2008 was 7 %. There are considerable differences in unemployment rates between Member States, the highest being 11.3 % in Spain and the lowest (less than 4 %) in Cyprus, Denmark, Austria and the Netherlands. The distribution of unemployment rates across the EU cities is considerably wider.
As the reference year of the last available data for unemployment differs, our analysis is divided accordingly. As shown on Map 2 in 2008, Dutch, Swiss and Norwegian cities had the lowest unemployment rates, and the highest rates were in east German and Belgian cities. Unemployment was also high in several Polish, Portuguese and Romanian cities; here the data refer to the year 2004. The largest disparities between cities within a country were recorded in Belgium, Spain, France and Romania. For example, in Belgium the unemployment rate was below 5 % in Brugge, while in Charleroi it was above 15 %. This underlies the need to examine the territorial aspects of unemployment.
Students in higher education
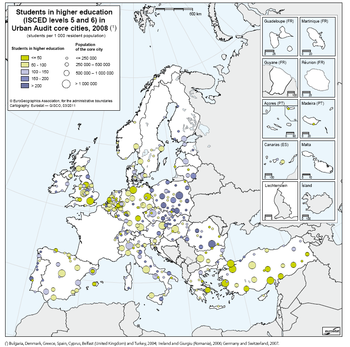
Whether cities experience a ‘brain drain’ or a ‘brain gain’ depends on a number of factors, including their ability to attract students to their colleges and universities. Retaining university and college graduates in the city is the next step to establishing a highly skilled workforce. Map 3 shows the number of students in universities and other further education establishments per 1 000 resident population. Almost all participating countries have ‘university cities’. Cities where more than 200 students per 1 000 inhabitants are enrolled in higher education are widely dispersed across Europe. However, Poland, Slovakia, the Czech Republic and Portugal have a high concentration of these cities.
Looking at the number of students relative to inhabitants means that large cities have a relatively low indicator value, although many host prestigious and large universities. Warszawa (Poland) and Bucureşti (Romania) are the only cities with more than 1 million inhabitants where the number of students is above 200 per 1 000 residents. Assessing the absolute number of students in colleges and universities could be an alternative indicator.
Perception of poverty
The image of a city has its roots in associations, memories and feelings linked to the city. Therefore, in addition to hard facts on social exclusion and poverty, the perception of a city’s residents is crucial. The Urban Audit perception survey was undertaken to find out how citizens feel and think about their city.
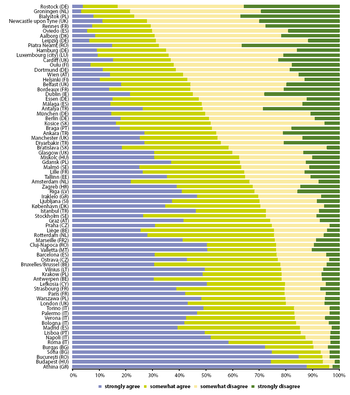
In this public opinion survey on the quality of urban life, respondents were asked if they strongly agree, somewhat agree, somewhat disagree or strongly disagree with the statement that poverty is a problem in their city. Figure 1 illustrates their responses.
Respondents’ perceptions of poverty varied widely between European cities. Half or more respondents in Aalborg (Denmark), Oulu (Finland), Praha (Czech Republic), Oviedo (Spain), Valletta (Malta), Bratislava (Slovakia), Luxembourg, Groningen (Netherlands) and København (Denmark) somewhat or strongly disagreed that poverty was a problem in their city. On the other hand, about nine out of 10 interviewees in Miskolc (Hungary), Riga (Latvia), Budapest (Hungary), Lisboa (Portugal) and Diyarbakir (Turkey) somewhat or strongly agreed that poverty was a problem in their city.[2]
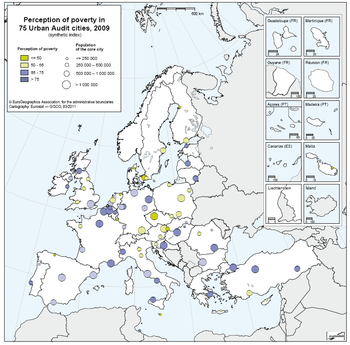
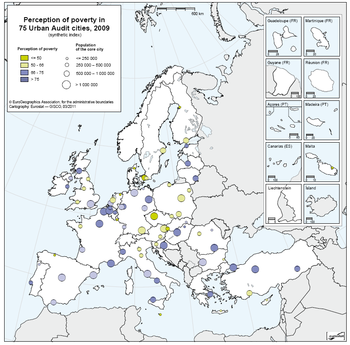
Map 4 illustrates the synthetic index of the perception of poverty. This was calculated from the responses given to the above question. A synthetic index value below 50 means that respondents who did not think that poverty was a problem outnumbered those who believed it was an issue.
Bulgaria and Romania have the highest share of the population at risk of poverty or exclusion as defined by the Europe 2020 strategy. (See the table on ‘Population at risk of poverty or exclusion’ on the Eurostat website, online data code: t2020_50.) Nevertheless, both countries have one city where inhabitants have a relatively favourable perception of poverty. Belgium, on the other hand, ranks in the ‘middle league’ at national level based on the share of population at risk of poverty or exclusion, but in the surveyed Belgian cities, poverty is perceived to be a problem by most citizens. This shows the need for the Europe 2020 strategy to have an urban dimension.
Perception of air pollution
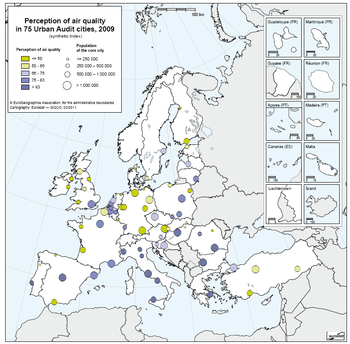
Air pollution appears to be a problem in most cities, with some exceptions. Respondents in Rostock (Germany), Groningen (Netherlands) and Białystok (Poland) mainly felt that air pollution was not a problem in their city. In Oviedo (Spain), Rennes (France), Newcastle (United Kingdom), Piatra Neamt (Romania), Leipzig (Germany) and Aalborg (Denmark), about two thirds of respondents somewhat or strongly disagreed that air pollution was an issue. Figure 2 shows the distribution of answers for all cities.
The size of the city seems to matter. Seventeen out of the 23 cities where the majority of respondents thought that air pollution was not a major problem have 500 000 or fewer inhabitants, shown by the dark green circles on Map 5. Nine out of the 13 cities with the most unfavourable perception of air pollution have more than 500 000 inhabitants, shown by the dark blue circles on Map 5.
Data sources and availability
The initial pilot study on the Urban Audit covered 58 cities in 1999, but the data collection has since expanded and currently includes more than 350 cities. A city can be designated as an urban settlement (morphological concept) or as a legal entity (administrative concept). The Urban Audit uses the latter concept and defines a ‘core city’ according to political and administrative boundaries. Data used to produce the maps in this chapter reflect this definition. However, economic activity, labour force, air pollution and other issues clearly cross the administrative boundaries of a city. To capture information at this extended level, the ‘larger urban zone’ was defined based on commuter flows. The larger urban zone includes the core city and the ‘commuter belt’ around it. The selection of Urban Audit cities was based on several criteria and agreed bilaterally with the national statistical institutes. Map 1 illustrates the geographical spread of Urban Audit cities.
Five reference periods have been defined so far for the Urban Audit and for each period a reference year was set: 1991, 1996, 2001, 2004 and 2008. Where possible, cities were asked to provide data for these years. An adjacent year was chosen when figures were not available for the reference year. Collecting ‘historical’ data is always more difficult, so for 1991 and 1996, only figures on key indicators are available.
More than 300 indicators were defined and calculated, covering most aspects of quality of life in a city including demography, housing, health, crime, labour market, income disparity, local administration, educational qualifications, environment, climate, travel patterns, information society and cultural infrastructure.
Data availability differs from domain to domain. Data on demography are available for more than 90 % of cities, but data on the environment are available for fewer than half of the cities.
The Urban Audit perception survey is a useful complement to the statistics. The last survey took place in 2009 and included 75 cities in the EU, Croatia and Turkey. Survey data were collected through telephone interviews of samples of 500 people per city. The synthetic indexes presented on Maps 4 and 5 were calculated in two steps: first, the difference between the number of those who agree and disagree was divided by the number of respondents. Then the index was standardised at a value between 0 and 100. The higher the index value, the greater the level of agreement in the city. Values below 50 suggest that more than half of the respondents disagreed.
Context
Cities are focal points of consumption of energy and materials. They are hubs of transport networks, bringing together polluters and protectors of the environment, skilled workers and unemployed, the homeless and the wealthy, culture and crime. Are they on course to reach the targets set by 2020? Eurostat invites everyone to come to their own conclusions and to see where they stand by looking at the figures in the Urban Audit data collection available on the Eurostat website
See also
- European cities - spatial dimension (background article)
- Statistics on European cities
- Sustainable development - demographic changes
- Urban-rural typology (background article)
Further Eurostat information
Publications
- Eurostat regional yearbook 2013, chapters 12 and 13
- Quality of life in cities - Perception survey in 79 European cities - European Commission, Flash Eurobarometer 366, October 2013 (PDF file)
- Sustainable development in the European Union - Key messages - 2013 edition
Database
- Regions and cities, see:
- City statistics - Urban Audit
Dedicated section
Methodology / Metadata
- Urban Audit (ESMS metadata file — urb_esms)
Source data for tables, figures and maps on this page (MS Excel)
Notes
- ↑ Council of the European Union, ‘Review of the EU sustainable development strategy (EU SDS) — Renewed strategy’, 10117/06.
- ↑ European Commission - Directorate-General for Regional Policy, Survey on perception of quality of life in 75 European Cities, Publications Office of the European Union, Luxembourg, 2010 (PDF file).
