Archive:Forestry statistics
- Data from September 2008, most recent data: Further Eurostat information, Main tables and Database.
This article presents some basic statistics on forestry in the European Union (EU). The EU had a total area of forests and other wooded land of 176.7 million hectares in 2005, equivalent to approximately 42 % of its land area. The largest forest and wooded-land areas are found in Sweden, Spain and Finland. In these three Member States, as well as in Estonia, Greece and Slovenia, forest and wooded-land areas made up more than half of the total land area, with Latvia and Austria recording shares just below 50 %.
Main statistical findings
After strong growth in the volume of EU roundwood production in 2005, production dropped to 425 million cubic metres in 2006. Sweden, Germany, France and Finland each recorded volumes in excess of 50 million cubic metres in all of the years from 2005 to 2007, and were clearly the largest producers (see Table 1). In terms of roundwood production per capita (see Table 2), Finland and Sweden were the most specialized Member States, followed by Latvia, Estonia and Austria.
Roundwood production can be divided into coniferous and non-coniferous species, with the former generally referred to as softwood, and the latter as broadleaved or hardwood. Almost 80 % of EU roundwood production in 2006 was from coniferous species. There has also been growth in the volume of EU sawnwood production in recent years, reaching 112 million cubic metres by 2006, almost 10 % more than in 2003.
The production of paper and paperboard in the EU reached 102 million tonnes in 2006 (see Table 3), 4.3 % more than the previous year, continuing an upward trend in output that started in 2002. Relative to its size (in population terms), Finland had by far the highest output of paper and paperboard in 2007, some 2.7 tonnes per capita, more than double the level in Sweden, and more than four times the level of the third most specialized producer, Austria (see Graph 1).
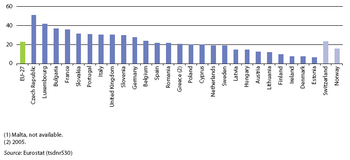
Between one-fifth and one-quarter of forest and woodland trees suffered from moderate or worse defoliation in the EU in 2006. More than one-third of trees suffered from defoliation in France and Bulgaria, with this proportion above 40 % in Luxembourg and just over 50 % in the Czech Republic.
Data sources and availability
An Intersecretariat Working Group (IWG) brings together Eurostat, the Timber committee of the United Nations Economic Commission for Europe (UNECE), the Forestry section of the United Nations Food and Agriculture Organization (FAO) and the International Tropical Timber Organisation (ITTO) to collect and collate forest sector statistics; other Directorates-General of the European Commission are also represented. The primary tool for statistical cooperation is the Eurostat/UNECE/FAO/ITTO Joint forest sector questionnaire (JFSQ), which is used by all organizations; each agency collects data from the countries for which it is responsible. Eurostat is responsible for data from the EU Member States and EFTA countries.
Roundwood production is a synonym for removals; it comprises all quantities of wood removed from forest and other wooded land or other felling sites during a given time period; it is reported in cubic metres underbark (i.e. excluding bark). Sawnwood production is wood that has been produced either by sawing lengthways or by a profile-chipping process and that exceeds 6 mm in thickness; it includes planks, beams, joists, boards, rafters, scantlings, laths, boxboards and lumber, etc., in the following forms: unplaned, planed, and end-jointed etc; it is reported in cubic metres solid volume (m³).
Paper and paperboard is the sum of:
- graphic papers
- newsprint
- sanitary and household papers
- packaging materials
- other paper and paperboard
It excludes manufactured paper products such as boxes, cartons, books and magazines, etc.
The degree of defoliation is the extent of visually assessed defoliation of trees and is based on a method developed by the International Cooperative Programme of the Executive Committee for the Convention on Long-range Transboundary Air Pollution in Europe. Damage is classed on a scale from 0 to 4. No defoliation (class 0) covers up to and including 10 % needle or leaf loss. Slight (warning stage) defoliation (class 1) covers from more than 10 % and up to 25 % needle/leaf loss. Moderate defoliation (class 2) covers more than 25 % and up to 60 % needle/leaf loss. Severe defoliation (class 3) covers more than 60 % and up to 100 % needle/leaf loss. Dead (class 4) covers 100 % defoliation.
Context
In 2006 the Commission underpinned its support for sustainable forest management and the multi-functional role of forests by adopting an EU forest action plan. The action plan provides a framework for forest-related actions and will serve as a coordination instrument between Community actions and the forest policies of the Member States. There are 18 key actions proposed by the Commission to be implemented jointly with the Member States during the period 2007-2011. The Action Plan focuses on four main objectives:
- improving long-term competitiveness
- improving and protecting the environment
- contributing to quality of life
- fostering coordination and communication
Further Eurostat information
Publications
Main tables
- Forestry, see:
- Data Navigation Tree
- Main tables (new codes.xls)
- Agriculture, forestry and fisheries
- Forestry (t_for)
- Agriculture, forestry and fisheries
- Main tables (new codes.xls)
Database
- Forestry, see:
- Data Navigation Tree
- Main tables (new codes.xls)
- Agriculture, forestry and fisheries
- Forestry (t_for)
- Agriculture, forestry and fisheries
- Main tables (new codes.xls)
Dedicated section
Other information
- Joint Forest Sector Questionnaire (JFSQ) (Presentation)
- Manual on the Economic Accounts for Agriculture and Forestry EAA/EAF 97 (Rev.1.1)
- The actual JFSQ used
External links
- United Nations Economic Commission for Europe (UNECE) - UNECE / FAO Timber Section
- Food and Agriculture Organization of the United Nations (FAO) - Forestry
- International Tropical Timber Organisation (ITTO)
- European Union Forest Action Plan
- Forest-based sector European Technology Platform


