Archive:Sustainable development - natural resources
- Data from October 2013. Most recent data: Further Eurostat information, Database.
This article provides an overview of statistical data on sustainable development in the area of natural resources. They are based on the set of sustainable development indicators the European Union (EU) agreed upon for monitoring its sustainable development strategy. Together with similar indicators for other areas, they make up the report 'Sustainable development in the European Union - 2013 monitoring report of the EU sustainable development strategy', which Eurostat draws up every two years to provide an objective statistical picture of progress towards the goals and objectives set by the EU sustainable development strategy and which underpins the European Commission’s report on its implementation.
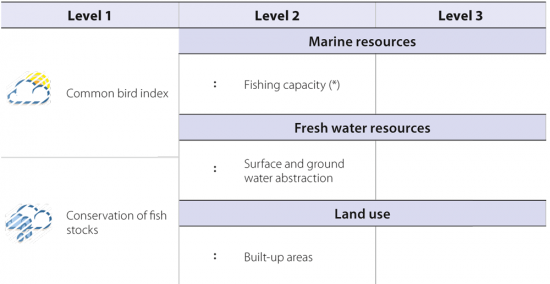
The table below summarises the state of affairs of in the area of natural resources. Quantitative rules applied consistently across indicators, and visualised through weather symbols, provide a relative assessment of whether Europe is moving in the right direction, and at a sufficient pace, given the objectives and targets defined in the strategy.
Overview of main changes
Despite some improvements, the EU’s natural resources are under continuous pressure. Ecosystems and their services, which are the backbone of biodiversity and human well-being, are increasingly threatened by land take for settlements and infrastructure as well as intensification of agricultural production. Some progress can be observed in marine resources. Yet it should be interpreted cautiously because a reduction in the size of the EU fishing fleet has not yet led to a meaningful recovery of fish stocks. Further reforms of and new concepts within agriculture, fish and water policies, as well as in transport and consumption and production, will be needed to put use of natural resources in the EU on a sustainable path.
Main statistical findings
Headline indicators
Abundance of common birds
1.1 % increase in the EU index for all common birds between 2000 and 2011. While forest birds showed an even stronger recovery, farmland birds declined further, reaching a record

low in 2011

The index of all common birds [1] remained relatively stable, increasing by an average of only 0.1 % annually between 2000 and 2011. A slight increase from 2009 to 2011 has returned the common bird index to a value of 87.7, putting it 0.9 percentage points above the 2000 value. Between 1990 and 2000, the index showed a steep average decline of 1.2 % per year (between 1990 and 2000).
Behind the relatively stable common bird trends lie more polarised trends in the populations of common farmland and forest birds.
While forest birds increased by 9.7 percentage points between 2000 and 2011, farmland birds continued to decrease dramatically and reached an all-time low in 2010. Between 1990 and 2000, the farmland bird index declined by about 1.4 % per year on average. The index dropped by 5.6 percentage points between 2000 and 2011. Some of the species that declined the most over the past three decades include familiar farmland birds such as the grey partridge Perdix perdix (– 82 %), skylark Alauda arvensis (– 46 %), linnet Carduelis cannabina (– 62 %) and corn bunting Miliaria calandra (– 66 %) Cite error: Closing </ref> missing for <ref> tag, all of which have a ‘least concerned’ status on the IUCN Red List, version 3.1 [2] [3] .
- Farmland bird diversity in the EU: still in decline
A strong discrepancy exists between relatively stable common bird population numbers and a significantly declining farmland bird trend. ‘All common birds’ include species from different habitats, including the increasing forest populations, among which habitat generalists are well represented. The trend therefore shows that bird species that are more dedicated to specific habitats are increasingly under threat in the EU. Ongoing land use changes and increasing land take by human activities seem to have less harmful impacts on less specialised bird species. As a result, a continuation of current land use practices would inevitably lead to a further narrowing of bird species occurrences to those less vulnerable to human activities.
- How the abundance of farmland birds varies between Member States
The common farmland bird index has declined in many of the 18 Member States for which data are available [4]. This is seen most strongly in the old Member States (EU-15). Norway, Germany, Austria and Denmark showed the highest annual average rates of decline, while Latvia, Finland, Estonia, Hungary and Italy showed the most positive trends. Compared with their 2000–2007 averages, Hungary, Poland and the Czech Republic showed improvements in 2008.
- Declines in farmland bird populations mainly driven by agricultural changes
Recent evidence indicates that changes in agricultural methods, intensification and specialisation are largely responsible for farmland bird declines in Northern and Western Europe [5]. According to one study, some species such as the ruff (Philomachus pugnax) may have changed their migratory route when flying north to their breeding grounds in Northern Europe and to Asia from Africa because of a reduction in their food supply due to intensive agriculture — in this case especially in the Netherlands [6]. The study concludes that although ruffs appear to be able to shift migratory routes, environmental changes, such as habitat degradation and loss, can seriously affect other migrant bird populations.
Several factors have been cited as being particularly harmful in terms of agricultural intensification in the EU: hedgerow loss, land drainage, increased mechanisation, increased fertiliser and pesticide use, reduced spring cultivation, simplification of crop rotations, changes in crop use, and loss of farm diversity [7]. These changes are linked to the EU’s Common Agriculture Policy, which has been cited as providing harmful subsidies and failing to promote sufficient incentives for maintaining High Nature Value farmland and therewith the practices sustaining farmland biodiversity [8]. High Nature Value farmland refers to areas which are predominantly agricultural and support high levels of species and habitat diversity and/or species of conservation concern.
- Bioenergy production also plays a role in the decline in farmland birds
Furthermore, rising demand for biomass for bioenergy production has led to a significant increase in cultivation of high-input crops such as corn and rape, which has resulted in additional threats to biodiversity and ecosystem functions. Consequently, fallow land, which is an important habitat for many farmland species, has been increasingly used to grow energy crops.
- EU trends in common bird levels compared with other countries in the world
Similar to declines in European farmland birds, populations of many common grassland and shrubland birds have also shrunk in North America, apparently in response to the intensification of agricultural practices. An analysis of state-level Breeding Bird Survey (BBS) data highlighted that 15 of 25 bird species (60 %) breeding in grassland habitats declined on average by 1.1 % per year over the period 1980–1999[9]. Common birds are also increasingly under pressure in North America. Another analysis highlighted the plight of 20 common bird species, all of which have lost more than half of their continental population since 1967 [10].
Conservation of fish stocks
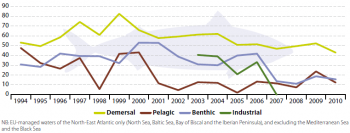
14.3 % of the total EU fish catches in 2010 were from stocks outside safe biological limits. Catches of non-industrial fish exceeded sustainable levels of exploitation

Total catches taken from stocks outside safe biological limits declined by 23.1 percentage points between 2000 and 2010. However,

after decreasing sharply between 2000 and 2002, annual values fluctuated around an average of 16.3 %, showing no clear trend towards more sustainable fish catches. Total fish stocks therefore remained threatened by overfishing in the North-East Atlantic.
- Are fish stocks under continuous threat?
It is not easy to derive clear messages from the indicator itself and the trend it depicts. The fluctuation in the curve of stocks outside safe biological limits is ambiguous because it is also influenced by changes in the annual fishing quota. Moreover, stocks of some species are not only influenced by catches, but also by the availability of species they depend on in the food web. Such an ecological perspective on marine ecosystems, however, is not covered by this indicator.
- Reform of the Common Fisheries Policy addresses important sustainability issues
Despite the uncertainties from the indicator, it is widely acknowledged that EU fisheries are affected by several interconnected problems. Most fish stocks are being overfished by a fishing fleet that is too large and too efficient. Besides ecological damage to marine ecosystems, overfishing bears high economic risks for the whole fishing sector.
Marine reserves or ‘no-take zones’ have been recognised as an effective tool for conserving and replenishing fish stocks. By nurturing stocks within their boundaries it is expected that these areas also positively affect commercial stocks through a spill-over effect [11]. In this regard, the implementation of the 2008 Marine Strategy Framework Directive, of which the main objective is to achieve ‘good environmental status’ in all EU marine regions by 2020, should also offer additional opportunities to address the current issues revolving around the management of marine biodiversity.
For demersal fish, which represent the highest values in unsustainable catches, the declining trend seems to have stabilised since 2005, while values of pelagic fish have fluctuated. In general, fishing depths in the EU have increased, with more deep-sea fish species being harvested [12]. Deep-sea fish populations are often more vulnerable to the effects of fishing and may suffer greater ecological impacts from overfishing than shallow-water species.
- EU trends in conservation of fish stocks compared with other countries in the world
At the global level, exploitation of fish stocks looks even more severe than in EU waters. The latest figures from the Food and Agriculture Organization of the United Nations (FAO) show that 57 % of the global oceanic fish stocks evaluated were ‘fully exploited’ in 2009, with harvest levels at or near the maximum sustainable yield (MSY). Some 30 % of stocks were ‘overexploited’, having been fished beyond MSY, and require strong management to rebuild. The share of stocks in this category has tripled since the mid-1970s. This leaves just 13 % of oceanic fish stocks in the ‘non-fully exploited’ category, down from 40 % in 1974[13].
Marine resources
Fishing capacity
2.4 % average annual decrease in EU fishing fleets from 2007 to 2012. Further reduction of fishing capacities in the EU is needed for recovering fish stocks

The EU-27 fishing fleet, measured by the total engine power of fishing vessels, decreased by 3.97 % on average per year from 2007 to 2012. An oversized EU fishing fleet has several negative economic consequences which undermine a transition to a green economy: fish stocks are overfished, the economic situation of parts of the fleet is fragile despite high levels of subsidies, jobs in the fishing sector are unattractive and the situation of many coastal communities that depend on fisheries is precarious [14].
- EU fishery policy at a turning point?
A smaller fishing fleet does not automatically mean fishing capacity is also shrinking. According to the Green Paper on the Reform of the Common Fisheries Policy (CFP) [15], decreases in fishing fleets may have been offset by technological progress, which is estimated to increase fishing efficiency by about 2–3 % per year [16].
This corresponds to the European Commission’s statement that despite a massive EUR 2 730 million being spent on scrapping fishing vessels between 1994 and 2013, the EU fishing capacity is still increasing by about 3 % every year [17]. The Commission concludes that none of the past policies to tackle the overcapacity of fishing fleets (Multi Annual Guidance Programmes, entry-to-exit ratios, capping the maximum fleet size, public scrapping schemes) have worked. As a result, the current proposal for reforming the CFP considers the introduction of a system of transferable fishing concessions (TFC) as a major driver for fleet capacity adjustment.
Following strict rules, Member States will be made responsible for designing TFC systems for their sea territories. The amount of TFCs given to fishing fleets will be directly bounded to the national fish quotas. It is also recommended that coastal communities dependant on fishing, more environmentally friendly fishing practices and artisanal fleets should be favoured in the allocation of TFCs.
Freshwater resources
Water abstraction
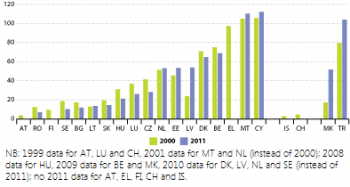
Water abstraction from ground and surface water seems to be sustainable in most Member States. Eleven countries appear to have stabilised abstraction pressure on water resources between

2000 and 2011

Total water abstraction has decreased over the past decade in most European regions, with the exception of South-Western Europe where it has been constant [18]. Consumption of both surface and groundwater is driven by four main activities: cooling in electricity production; public water supply; the manufacturing industry; and agriculture, forestry and fishing. Overall, 44 % of the total abstracted water is for energy production, 24 % for agriculture, 21 % for public water supply and 11 % for industry.
- How water abstraction varies between Member States
The amount of water which is actually available for abstraction is strongly determined by geographical location. Geo-climatic differences strongly influence the amount of surface water and groundwater available for use. Thus the figures vary significantly across the Member States for which data is available. In southern countries, agricultural water abstraction accounts for 60 % of the total [19].
From 2000 to 2011, overall, annual surface water abstraction remained relatively stable in most Member States for which data is available. Only Cyprus, Estonia and — to a limited extent Bulgaria and the Czech Republic — increased surface water abstraction, reaching 36 % of renewable resources in 2011. In contrast, countries such as Lithuania, Romania and Belgium made a major step towards more sustainable abstraction. A study of global water use showed that technological developments improve water use efficiency and save water [20]. In the domestic sector, improved water infrastructure, advances in water-efficient appliances, water metering and water pricing led to only moderate increases in global water use between 1980 and 1995.
In many Member States groundwater abstraction slightly decreased between 2000 and 2011. However, this mainly counts for those countries whose water abstraction remains within sustainable levels anyway. In other countries such as Malta and Cyprus, which already exceeded a sustainable level, groundwater abstraction even increased further in 2011, albeit slightly.
- How successful is current EU Water Policy?
Unfortunately, the measures developed and implemented by Member States in reaction to the Communication on water scarcity and droughts in the EU were found to be limited and in some cases even contradictory to achieving its objectives [21]. This shows the need for a new impulse from the EU to step up efforts to protect water resources. The protection of water resources is also a critical part in the ‘Blueprint to safeguard Europe’s water resources’ [22], which was published in late 2012.
Land use
Built-up areas
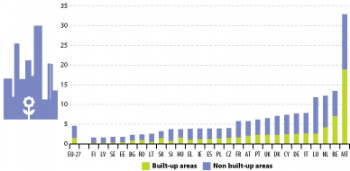
4.6 % of the EU land area was covered by artificial areas in 2012. Urbanisation and increasing transport infrastructure are the main drivers of land sealing
Artificial areas, both built-up (mainly buildings and greenhouses) and non-built-up (areas covered by artificial surfaces), are continuously encroaching on farmland, forests and semi-natural land [23]. Across the EU, almost 5 % of the land area is artificial. About two thirds of this artificial area is non built-up land, mainly transport infrastructure (such as roads, railways) and parking areas [24].
- How coverage by artificial land and built-up areas varies between Member States
The highest shares of artificial areas in total land area were recorded in Malta (32.9 %), Belgium (13.4 %), the Netherlands (12.2 %) and Luxembourg (11.9 %). The ‘Benelux’ countries host the most densely populated regions and thus are the most densely built-up and non-built up areas [25]. Two Nordic and two Baltic countries rank lowest: Finland and Latvia (1.6 % each) and Sweden and Estonia (1.8 % each). These countries are among the least densely populated and therefore, artificial area coverage is low.
See also
- Agri-environmental indicators
- All articles on sustainable development indicators
- Biodiversity statistics
- Environmental Data Centre on Natural Resources and Products (EDCNRP)
- Water statistics
Further Eurostat information
Publications
- Forestry in the EU and the world: A statistical portrait - 2011 edition
- Land Use/Cover area frame Survey: Results on EU land cover and use published for the first time - Eurostat news release from 4 October 2010
- Sustainable development in the European Union - 2011 monitoring report of the EU sustainable development strategy
Main tables
- Natural Resources
Dedicated section
Methodology
More detailed information on natural resources indicators, such as indicator relevance, definitions, methodological notes, background and potential linkages, can be found on page 281-305 of the publication Sustainable development in the European Union - 2011 monitoring report of the EU sustainable development strategy.
Other information
- Our life insurance, our natural capital: an EU biodiversity strategy to 2020, Commission communication COM(2011) 244
External links
- Assessing biodiversity in Europe - the 2010 report - EEA report No. 5/2010
- EU 2010 Biodiversity Baseline - EEA technical report No. 12/2010
- European Environment Agency - EEA
- Facts and figures on the Common Fisheries Policy - 2010 Edition - European Commission - Directorate-General for Maritime Affairs and Fisheries
- The Economics of Ecosystems and Biodiversity (TEEB) reports
- The European Environment - state and outlook 2010 - EEA
Notes
- ↑ The EU aggregate figure is an estimate based on the following 18 Member States: United Kingdom, Sweden, Denmark, Czech Republic, Finland, France, the Netherlands, Germany, Belgium, Latvia, Spain, Austria, Ireland, Hungary, Italy, Poland, Estonia and Portugal. For the other Member States, no data is available. In the 1980s there were even fewer countries represented by the index. Thus, those declines in the bird index only refer to less than 18 countries.
- ↑ http://www.iucnredlist.org/static/categories_criteria_3_1
- ↑ The International Union for Conservation of Nature (IUCN) Red List Categories and Criteria are a system for classifying species at high risk of global extinction. The general aim of the system is to provide an explicit, objective framework for the classification of the broadest range of species according to their extinction risk.
- ↑ The EU aggregate figure is an estimate based on 18 Member States; the following MS were not included in the figure:Bulgaria, Greece, Cyprus, Lithuania, Luxembourg, Malta, Romania, Slovenia and Slovakia. Monitoring data are either lacking, fragmented or of low quality.
- ↑ BirdLife International (2013), Europe-wide monitoring schemes highlight declines in widespread farmland birds. Presented as part of the BirdLife State of the world’s birds website. Available from: www.birdlife.org/datazone/sowb/casestudy/62. Checked: 08/08/2013
- ↑ Verkuil, Y.I., Karlionova, N., Rakhimberdiev, E.N. et al 2012) Losing a staging area: Eastward redistribution of Afro-Eurasian ruffs is associated with deteriorating fuelling conditions along the western flyway. Biological Conservation. 149: 51–59
- ↑ BirdLife International (nd), Common bird indicators: helping to track progress towards the 2010 target.
- ↑ BirdLife International (2012), On the road to recovery? BirdLife assessment of progress on the EU 2020 Biodiversity Strategy, October 2012
- ↑ For further information see BirdLife (State of the world’s birds): http://www.birdlife.org/datazone/sowb.
- ↑ Most of the world’s countries lack the extensive, long-term monitoring schemes found in Europe and North-America. This is why figures on the global scale are rather ambiguous.
- ↑ World Resource Institute, Fishing for answers. Making sense of the global fish crisis, Washington, DC, 2004.
- ↑ Villasante S, Morato T, Rodriguez-Gonzalez D, et al. (2012) Sustainability of deep-sea fish species under the European Union Common Fisheries Policy, Ocean and Coastal Management 70, pp. 31–37.
- ↑ Food and Agriculture Organisation (FAO), Review of the state of world marine fishery resources, Rome, 2011
- ↑ Commission Communication, Reform of the Common Fisheries Policy, COM(2011)417 final
- ↑ Commission Green Paper, Reform of the Common Fisheries Policy, COM(2009)163.
- ↑ Banks, R., Cunningham, S., Davidse, W.P., Lindebo, E., Reed, A., Sourisseau, E. and De Wilde, J.W., The impact of technological progress on fishing effort, report prepared for the European Commission, 2002.
- ↑ European Commission, CFP reform — Transferable Fishing Concessions. Additional information to CFP Reform Package.
- ↑ See also EEA, Water Exploitation Index, http://www.eea.europa.eu/data-and-maps/indicators/water-exploitation-index
- ↑ European Environment Agency, Water resources across Europe — confronting water scarcity and drought, EEA Report No 2/2009, Publications Office of the European Union, Luxembourg, 2009
- ↑ Flörke, M., Kynast, E., I Bärlund, I. et al. (2013) Domestic and industrial water uses of the past 60 years as a mirror of socio-economic development: A global simulation study. Global Environmental Change 23: p. 144–156.
- ↑ Strosser P., Dworak, T., Garzon Delvaux, P.A., Berglund, M., Schmidt, G., Mysiak, J., Kossida, M., Iacovides, I., Ashton, V. (2012) Gap Analysis of the Water Scarcity and Droughts Policy in the EU.
- ↑ Commission Communication, The blueprint to safeguard Europe’s water resources, COM(2012)673.
- ↑ EEA 2012, Environmental Indicator Report, 2012, Ecosystem Resilience and Resource Efficiency in a Green Economy in Europe. Copenhagen.
- ↑ Eurostat 2011, Regional yearbook 2011, Chapter 12 Land cover and land use, pp. 157–167.
- ↑ EEA 2011, Green infrastructure and territorial cohesion. The concept of green infrastructure and its integration into policies using monitoring systems, EEA Technical report No 18/2011, Copenhagen.


