Archive:Fishery statistics in detail
- Data from September 2013. Most recent data: Further Eurostat information, Main tables and Database.
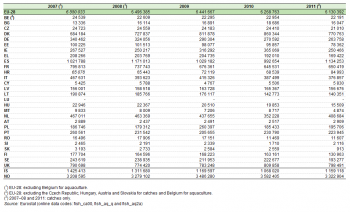
(tonnes live weight) - Source: Eurostat (fish_ca00), (fish_aq_q) and (fish_aq2a)
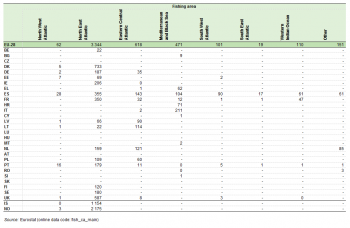
(1 000 tonnes live weight, rounded) - Source: Eurostat (fish_ca_main)
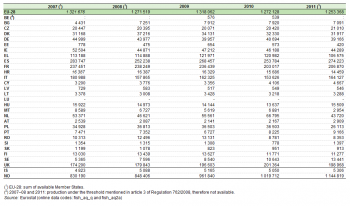
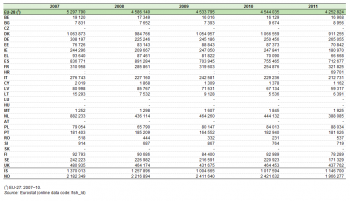
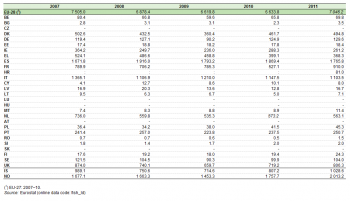
(tonnes live weight) - Source: Eurostat (fish_aq_q) and (fish_aq2a)
This article gives an overview of recent statistics relating to fishing fleets, fish catches, landings and aquaculture production in the European Union (EU).
Fish are a natural, biological, mobile (sometimes over long distances) and renewable resource. Aside from fish farming, fish in the wild are generally not owned until they have been caught; although some lakes and stretches of rivers may be privately owned. As such, fish stocks continue to be regarded as a common resource which needs to be managed collectively. This has led to a range of policies that regulate the amount of fishing, as well as the types of fishing techniques and gear that can be used in fish capture. At a European level, Eurostat collects data on catches and landings of various fishery products, aquaculture production and the size and power of fishing fleets. The collection of this information is carried out in collaboration with other international organisations.
Main statistical findings
Fishing fleet
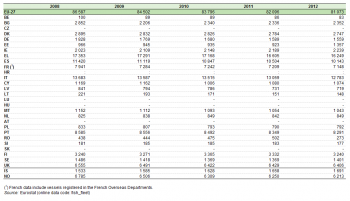
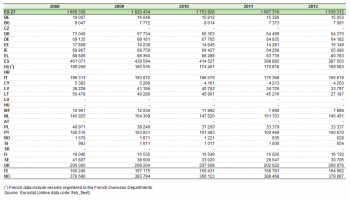
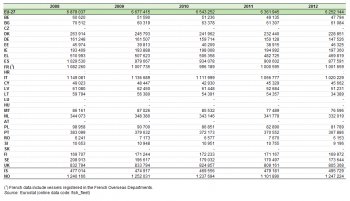
The EU’s fishing fleet capacity has declined fairly steadily since the early 1990s, in terms of both tonnage (an indicator of fish-holding capacity) and engine power (an indicator of the power available for fishing gear). The EU-27 fishing fleet had fallen to about 81 000 vessels in 2012; the number of vessels for just the EU-15 being 104 000 in 1995. The EU’s fishing fleet in 2012 had a combined 1.6 million gross tonnes of capacity with a total engine power of 6.3 million kilowatts.
About one fifth (20.0 %) of the EU-27’s fishing fleet was registered in Greece. On average, however, these vessels were small, with an average size of 5.0 gross tonnes (much less than the EU-27 average of 20.2) and an average engine power of 28.9 kilowatts in 2012 (compared with an EU-27 average of 77.1 kilowatts). In terms of capacity, Spain, the United Kingdom, France and Italy had the largest fishing fleets, accounting for a combined majority of gross tonnage (56.5 % in 2012) and engine power (59.3 % in 2012).
The capacities of most national fishing fleets declined in the short period between 2008 and 2012 (there being little change in Finland and the Netherlands in terms of tonnage). The downsizing of capacity in Spain, France and Italy was in line with the average for the EU-27 for this period, but was smaller for the United Kingdom.
This reduced capacity in the EU-27 was in contrast to the maintenance of fishing fleet capacities in Iceland and Norway. The capacity of the Norwegian fishing fleet (about 380 000 gross tonnes) was similar to Spain in terms of overall tonnage (although the average of 61.0 gross tonnes per vessel was considerably higher than in Spain), while the Norwegian fishing fleet was considerably larger than that of any EU Member State in terms of engine power. In the case of Iceland, despite having a much smaller fleet than France and Italy in terms of numbers of vessels, the overall holding capacity (gross tonnage) was very similar.
Total production
The EU was one of the biggest fishery producers in the world in 2010 (accounting for a little less than 5 % of global production) albeit dwarfed by production from China, which accounted for about one third of global output.
Total fishery production covers total catches excluding inland catches as well as aquaculture production excluding the output of fish hatcheries and nurseries. The total production of fishery products in the EU was an estimated 6.1 million tonnes of live weight equivalent (in other words, the mass or weight when removed from water) in 2011. It should be noted that this figure exclude catches data for the Czech Republic, Hungary, Austria and Slovakia as well as aquaculture production in Belgium. The EU figure for 2011 suggests there was another fall in fishery production, continuing the steady decline noted over the previous 20 years.
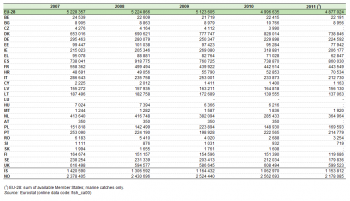
Within the EU, the three largest fishery producers in terms of volume in 2011 were Spain (1.1 million live weight tonnes), the United Kingdom (0.8 million live weight tonnes) and Denmark (0.8 million live weight tonnes). Despite the overall downward development of fishery production at an EU level, output from each of these countries was estimated to have increased between 2007 and 2011 (see Table 4). Total fisheries production in Spain rebounded strongly in 2011 and was estimated to be 11.0 % higher than in 2007; production in United Kingdom declined in 2011 but remained similar (1.0 % higher) than its level from 2007, and; despite a sharp decline in 2011 (a fall of 10.4 % on the year before), total fishery production in Denmark was 12.7 % higher than in 2007. By contrast, there were some sharp declines in production among other principal producers from the EU Member States: in the Netherlands and Portugal the decline in fishery production during the period 2007–11 was 10–15 %, and in Italy, Germany and Sweden slightly more than 20 %.
It is also worth noting that total fisheries production in Iceland (1.2 million tonnes of live weight) and Norway (3.3 million tonnes of live weight) was larger than that of any of the EU Member States in 2011. Although production in Norway was lower in 2011 than in 2010, it remained 3.6 % higher than its level in 2007. By contrast, although production in Iceland was higher in 2011 than in 2010, it remained almost a fifth (-18.7 %) below its level of 2007.
Catches
About 80 % of the EU-28’s total fishery production relates to catches. The live weight of catches for the EU-28 was 5.0 million tonnes in 2010. From the data available for 2011, it is possible to estimate that the volume of catches fell by 2–3 % to about 4.9 million tonnes of live weight. This would represent an overall decline of about 40 % or 3.2 million tonnes of live weight since 1995. The development of catches among the EU Member States during the period from 2007–11 closely mirrored the patterns highlighted above for fisheries production.
Although the European fishing fleet operates worldwide, EU catches are taken primarily from the Eastern Atlantic and the Mediterranean (see Table 6). Indeed, almost 70 % of EU-28 catches were made in the North East Atlantic in 2011, with about another fifth coming from the Eastern Central Atlantic (12.7 %) and the Mediterranean and Black Sea (9.7 %).
Landings
Landings data relate to fishery products (product weight and value) landed in a country regardless of the nationality of the vessel making the landings. The figures for a reporting country therefore exclude landings by vessels of the reporting country into foreign ports. A little over one fifth (21.4 % or 0.9 million tonnes of live weight) of the landings to EU-28 ports in 2011 were made in Denmark, the highest share among the EU Member States. Only landings to Spanish ports (0.7 million tonnes of product weight) came close to the level recorded for Denmark in 2011. By contrast, landings to ports in Iceland (1.1 million tonnes) and Norway (2.0 million tonnes) were much higher.
Denmark only accounted for a relatively small share (7.0 % in 2011) of EU-27 landings in terms of value. One quarter of the value of landings for the EU-27 in 2011 came into Spanish ports (25.1 % or EUR 1.8 billion), reflecting the high value attached to its landings of species like tuna, pilchards, hake, squid and octopus. Landings in Italy had the next highest value (EUR 1.1 billion), followed by France and the United Kingdom. The value of landings to ports in Iceland (EUR 1.0 billion) and Norway (EUR 2.0 billion) were closer to the values in Italy and Spain respectively, reflecting the lower average price of the species landed in each of these countries.
Aquaculture
A broad range of species are farmed in aquaculture within the EU; the main species are Mediterranean mussel, rainbow trout, blue mussel, Atlantic salmon, Pacific cupped oyster and gilthead seabream.
About one fifth of the EU-28’s total fishery production comes from aquaculture; production was 1.3 million tonnes of live weight in 2011. This represented a decline in aquaculture production of about 12 % after the relative peak of 1999.
The four largest aquaculture producers among the EU Member States were Spain, France, the United Kingdom and Italy, which together accounted for almost two thirds of the EU-28’s aquaculture production in 2011. Aquaculture in each of these countries tends to be specialised: mussels accounted for about three quarters (76.1 %) of the live weight from aquaculture in Spain in 2011; oysters accounted for two fifths (40.8 %) and mussels about one third (36.1 %) of the live weight in France; salmon, trout and smelts accounted for the vast majority (85.9 %) of total aquaculture production in the United Kingdom; and mussels accounted for about half (48.4 %) and clams, cockles and arkshells for one fifth (19.6 %) of total aquaculture production in Italy.
There was a clear downward trend in aquaculture production levels in France and Italy between the late 1990s and 2010, although there was a small upswing in 2011. By contrast, there was relatively steady growth in the United Kingdom, although much of this was limited to the period through until 2004. Annual production levels in Spain fluctuated more widely than the other three main producer countries but the level of aquaculture production in 2011 was in the broad range recorded for most of the period since the early 2000s, although down from relative peaks recorded at the end of the 1990s.
Aquaculture production in Norway was almost as large in 2011 (1.1 million tonnes of live weight) as it was for the whole of the EU-28. Unlike developments for the EU, aquaculture production in Norway continued to expand rapidly after the late 1990s, continuing the trend since the establishment of aquaculture in the early 1980s. Even in the short period between 2007 and 2011, aquaculture production levels in Norway grew sharply (up 37.9 %). This growth has been largely focused on a single species, the Atlantic salmon.
Data sources and availability
Fishery statistics are collected from official national sources either directly by Eurostat for the members of the European Economic Area (EEA) or indirectly through other international organisations for other countries. The data are collected using internationally agreed concepts and definitions developed by the coordinating working party on fishery statistics (CWP), comprising Eurostat and several other international organisations with responsibilities in fishery statistics. The flag of the fishing vessel is used as the primary indication of the nationality of the catch, though this concept may vary in certain circumstances.
Concerning the fishing fleet, the data for the EU Member States are derived from the Community Fishing Fleet Register maintained by the European Commission’s Directorate-General for Fisheries and Maritime Affairs. Data for Iceland and Norway are compiled from fleet files submitted by the national authorities. Gross tonnage (GT) under the London convention (1969) was adopted as the unit of tonnage measurement in the 1990s. This was a change from the previously used gross registered tonnage (GRT) under the Oslo convention (1946). Implementation of the change involved re-measurement of vessels over time. This was carried out at different rates in different countries and was largely complete by 2003. However care should be taken when comparing data between countries and over time since the GT of a vessel is generally significantly greater than the GRT.
Catch statistics are submitted to Eurostat by EEA member countries in compliance with the following EU legislation:
- Regulation (EC) No 218/2009 of 11 March 2009 on the submission of nominal catch statistics by Member States fishing in the North-East Atlantic (OJ L87 of 31.03.2009);
- Regulation (EC) No 217/2009 of 11 March 2009 on the submission of catch and activity statistics by Member States fishing in the North-West Atlantic (OJ L87 of 31.03.2009);
- Regulation (EC) No 216/2009 of 11 March 2009 on the submission of nominal catch statistics by Member States fishing in certain areas other than those of the North Atlantic (OJ L87 of 31.03.2009, p.1).
Regional fisheries organisations and the United Nations Food and Agriculture Organisation (FAO) make the data for non-EEA countries available to Eurostat.
The national authorities are requested to submit catch statistics for all commercial, subsistence and recreational fisheries. However, the reporting of data for recreational fisheries is known to be incomplete.
The data are reported as the live weight equivalent of the landings (in other words, the landed weight of a product to which an appropriate conversion factor has been applied). The data therefore exclude quantities of fishery products which are caught but not landed. For example, fish caught but rejected at sea (a non-commercial species, under-sized fish, etc.) or fish consumed on board the vessel.
Each EEA member country reports annual data on the quantities and values of fishery products landed in its ports under the terms of:
- Regulation (EC) 1921/2006 of 18 December 2006 on the submission of statistical data on landings of fishery products in Member States and repealing Council Regulation (EEC)1382/91 (OJ L403 of 30 December 2006).
Data for landings (expressed as the product weight) relate to all fishery products landed in the reporting country, regardless of the nationality of the vessel making the landings. Landings by vessels of the reporting country in foreign ports are excluded.
The national authorities of EEA countries submit aquaculture production data to Eurostat under the terms of:
- Regulation (EC) No 762/2008 of 9 July 2008 on the submission by Member States of statistics on aquaculture and repealing Council Regulation (EC) 788/96 (OJ L218 of 13.08.2008).
- Regulation (EC) No 788/96 of 22 April 1996 on the submission by Member States of statistics on aquaculture production (OJL108 of 01.05.1996).
Context
The main objective of the Common Fisheries Policy (CFP) is to ensure sustainable exploitation of fisheries resources. Fleet capacity is an essential tool for achieving this aim. The European Union (EU) fleet, however, is very diverse, with the vast majority of boats being no more than 12 metres long but a small number of vessels being over 40 metres. Under EU legislation, the total capacity of the fishing fleet may not be increased. If public funds have been used to decommission a fishing vessel, then the corresponding capacity cannot be replaced or transferred; the reduction in fleet capacity is made permanent. The CFP also sets maximum quantities of fish that can be safely caught every year: the total allowable catch (TAC). Each country’s share is called a national quota.
Further Eurostat information
Publications
- Agriculture, forestry and fishery statistics — 2013 edition (Pocketbook)
- Fishery statistics — Data 1995–2008 (Pocketbook)
- Statistical data on the landings of fishery products in Member States and European Economic Area countries for 2008 — Data in focus 16/2010
- The EU-27 fishing fleet continued to decline in 2008 — Data 2005–2008 — Statistics in focus 49/2009
Main tables
- Fishing fleet, Total engine power (tsdnr420)
- Fishing fleet, Total tonnage (tag00083)
- Fishing Fleet, Number of Vessels (tag00116)
- Fishery production in all fishing regions (tag00117)
- Catches in all fishing regions (tag00076)
- Catches in the north-west Atlantic (tag00079)
- Catches in the north-east Atlantic (tag00078)
- Catches in the eastern central Atlantic (tag00080)
- Catches in the Mediterranean (tag00081)
- Aquaculture production, Total (tag00075)
Database
- Total fishery production (catch + aquaculture) (fish_pr)
- Catches by fishing area (fish_ca)
- Aquaculture production (fish_aq)
- Landings of fishery products (fish_ld)
- Fishing fleet (fish_fleet)
Dedicated section
Methodology / Metadata
- Aquaculture production [ESMS metadata file - fish_aq_esms]
- Catches by fishing area [ESMS metadata file - fish_ca_esms]
- Fishing fleet [ESMS metadata file - fish_fleet_esms]
- Landings of fishery products [ESMS metadata file - fish_ld_esms]
- Total fishery production (catch + aquaculture) [ESMS metadata file - fish_pr_esms]
Source data for tables, figures and maps (MS Excel)
Other information
Catch statistics:
- Regulation 216/2009 on the submission of nominal catch statistics by Member States fishing in certain areas other than those of the North Atlantic
- Regulation 217/2009 on the submission of catch and activity statistics by Member States fishing in the North-West Atlantic
- Regulation 218/2009 on the submission of nominal catch statistics by Member States fishing in the North-East Atlantic
Aquaculture:
- Regulations 788/96 and 762/2008 on the submission by Member States of statistics on aquaculture production
Landings:
- Regulation 1921/2006 on the submission of data on the landings of fishery products in Member States
Fishing fleet:
- Regulation 26/2004 on the Community fishing fleet register
External links
- European Commission — Fisheries
- Europa — Policy areas — Maritime affairs and fisheries
- FAO — Coordinating Working Party on Fishery Statistics (CWP)
See also
- Agriculture, forestry and fisheries introduced
- Fishery statistics backgrounds [[Category:<Fisheries>|Fishery statistics overview]] [[Category:<Statistical_article>|Fishery statistics overview]]
