Archive:Europe 2020 indicators - employment
Data from July 2013. Most recent data:
This article is part of a set of statistical articles based on Eurostat publication Smarter, greener, more sustainable? - Indicators to support the Europe 2020 strategy
=context, to be shortened to web introduction
Employment and other labour market-related issues are at the heart of the social and political debate in the EU. Paid employment is crucial for ensuring sufficient living standards and it provides the necessary base for people to achieve their personal goals and aspirations. Moreover, employment contributes to economic performance, quality of life and social inclusion, making it one of the cornerstones of socioeconomic development and well-being.
The EU’s workforce is shrinking as a result of demographic changes. A smaller number of workers are thus supporting a growing number of dependent people. This is putting at risk the sustainability of Europe’s social model, welfare systems, economic growth and public finances. In addition, steady gains in economic growth and job creation over the past decade have been wiped out by the recent economic crisis, exposing structural weaknesses in the EU’s economy. At the same time, global challenges are intensifying and competition from developed and emerging economies such as China or India is increasing [1].
(%)
Source: Eurostat online data code: (Ifsa_pganws)
(%)
Source: Eurostat online code (t2020_10)
(%)
Source: Eurostat online data code (2020_10)
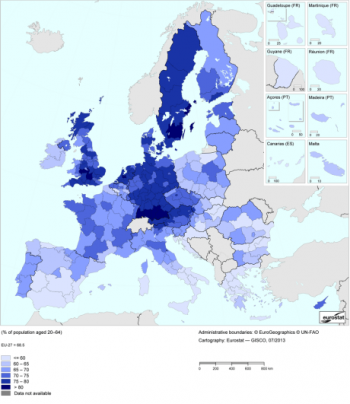
(% of the population aged 20 to 64)
Source: Eurostat online data code (lfst_r_lfe2emprt)
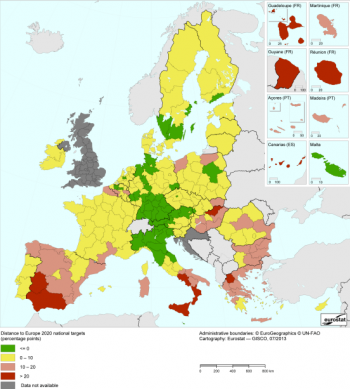
(% of the population aged 20 to 64)
Source: Eurostat online data code (lfst_r_lfe2emprt)
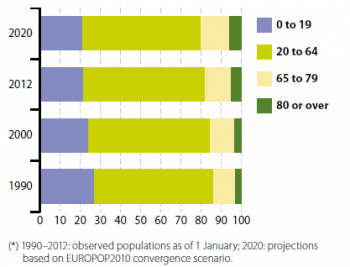
(%)
Source: Eurostat online data code (demo_pjangroup) and (proj_10c2150p)
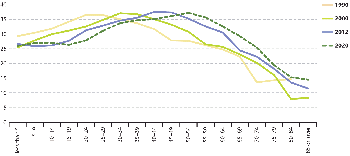
(million persons)
Source: Eurostat online data code (demo_pjangroup) and (proj_10c2150p)
left-hand scale: activity rates (%)
right-hand scale: share of age group in total population (%)
Source: Eurostat online data code (lfsa_pganws)
(%)
Source: Eurostat online data code (lfsa_pganws) and (tsdde100)

(difference between employment rates of men and women in percentage points)
Source: Eurostat online data code (lfsa_ergan)

(%)
Source: Eurostat online data code (lfsa_upgal) and (lfsa_urgaed)
(%)
Source: Eurostat online data code (lfsa_ergan)
Source: Eurostat online data code (lfsa_argaed)
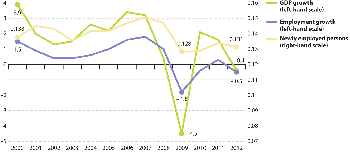
(left-hand scale: GDP growth and employment growth (percentage change over previous period)
(right-hand scale: newly employed persons (share of persons aged 20 to 64 whose job started within the past 12 months in total employment)
Source: Eurostat online data code (lfsi_grt_a) and (nama_gdp_k)
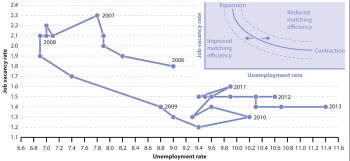
(%)
Source: Eurostat online data code (jvs_q_nace2), (jvs_q_nace1) and (une_rt_q)
Main statistical findings
Crisis brings rise in EU employment rate to a halt
The headline indicator ‘Employment rate — age group 20 to 64’ shows the share of employed 20 to 64 year olds in the total EU population.The reason for choosing this age group over the ‘usual’ working-age population 15 to 64 years old is explained in the chapter 'data sources and availability'
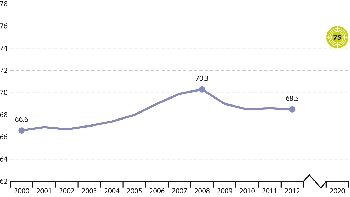
As indicated in Figure 1.3, the EU’s employment rate grew more or less steadily during the decade before the economic crisis, peaking slightly above 70 % in 2008. In 2009, however, the crisis hit the labour market, knocking the employment rate back to 69.0 % — the 2006 level. Employment in the EU continued to fall in 2010 to 68.5 %, where it has remained since. As a result, in 2012 the EU was 6.5 percentage points below the target value of 75 %.
North–South divide in employment rates across the EU
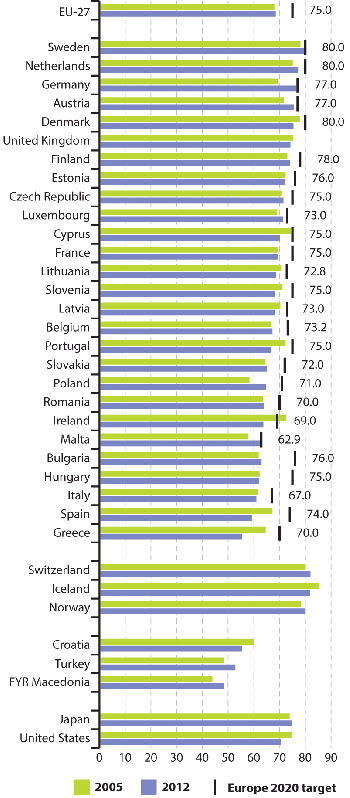
To reflect different national circumstances, the common EU target has been translated into national targets [2]. These range from 62.9 % for Malta to 80.0 % for Denmark, the Netherlands and Sweden. In 2012, Malta was the only country to have already met its national target. Of the remaining Member States, Germany and Sweden were closest, at 0.3 and 0.6 percentage points below their national targets respectively. Greece and Spain were the most distant at 14.7 percentage points below.
Employment rates among EU Member States ranged from 55 % to almost 80 % in 2012. Northern and Central Europe had the highest rates, in particular Sweden, the Netherlands, Germany, Denmark and Austria. All of these countries exceeded the 75 % EU target. Countries at the lower end of the scale were Greece, Spain, Italy and Hungary. Rates in the European Free Trade Association (EFTA) countries Iceland, Norway and Switzerland tended to be higher than in the EU, while figures were lower in acceding countries. Employment rates in Japan and the United States were on the same level as the ‘best performing’ EU Member States, and above the EU-27 aggregate.
Over the past seven years, employment has fallen in more than half of the EU countries. In 2012, employment rates in 13 Member States were below 2005 levels. The strongest falls were in Greece (– 9.3 percentage points), Ireland (– 8.9 percentage points) and Spain (– 7.9 percentage points). In the remaining 14 Member States, rates have risen since 2005, with the strongest growth in Germany (7.3 percentage points), Poland (6.4 percentage points) and Malta (5.2 percentage points).
The variations in the employment rate across different Member States, depicted in Figure 1.4, are also reflected in the maps of cross-country regional distribution of employment. As shown in Map 1.1 , countries with the highest employment rates, namely Sweden, the Netherlands, Germany, Denmark and Austria, were more likely to be comprised of regions with high employment rates. On the other hand, Southern and Eastern European countries with generally low employment rates tend to have more regions with average, low and very low employment intensity. This is particularly the case for the southern parts of Spain, Italy, Greece and Croatia, with employment rates below 60 %.
In 2012 Italy, Spain and France showed the biggest within-country dispersion of employment rates, with a factor of 1.5 to 1.8. This means that the worst performing regions in these countries had employment rates about 1.5 to 1.8 times lower than the best performing regions. In contrast, Denmark, the Netherlands, Austria, Portugal and Sweden were among the most ‘equal’ countries, with almost no disparities in employment rates across their regions.
Map 1.2 shows the distance of regions (at NUTS 2 level) to the respective national Europe 2020 targets. In accordance with employment dispersion across regions, the distance to the national employment targets shows considerable geographical variation within countries. It is not surprising that the regions with the lowest employment rates at the same time show the largest distance from their respective national targets. Almost all regions in Austria, Southern Germany and to a large extent North-Western Germany, the Southern parts of Sweden and the capital region in Poland have already exceeded or are on the way to reaching the national employment targets. However, most of the regions in Spain, Greece, Hungary, Bulgaria and South Italy still remain at a considerable distance from their Europe 2020 national commitments.
In addition to national targets for the overall employment rate, some Member States have also set education and subsidiary targets for specific labour market groups. These include women, older workers, non-EU citizens, young people and persons who are not in employment, education or training.
How long-term labour supply factors influence the employment rate
Employment rates are a result of labour supply and demand: workers supply labour to businesses and businesses demand labour from workers, both in exchange for wages. Consumers play an important role in businesses’ labour needs through their demand for products and services, which in turn is influenced by the cyclical development of the economy . Labour supply is characterised by the number of people available to the labour market (determined by demographic structure) and the skills they offer (approximated by education). However, the demographic structure of the economically active population and its education levels are two important factors that are hard to influence in the short term.
The EU’s labour force is shrinking because of population ageing
The EU is confronted with a growing, but ageing, population. This is driven by low fertility rates, continuous rises in life expectancy and retirement of the baby boomer generation born immediately after World War II. This ageing, already apparent in many Member States, means older people will make up a much greater share of the total population in the coming decades, while the share of the population aged 20 to 64 years will fall (see Figure 1.5). This in turn means that despite a growing population, the EU labour force is shrinking, increasing the burden on workers to provide for the social expenditure needed by an ageing population [3].
Over the past two decades, the total EU population grew from 470 million in 1990 to 504 million in 2012 [4]. Growth was mainly driven by a 10.0 % increase in the population aged 20 to 64 years and a 38.9 % rise in older persons aged 65 and above. In contrast, the number of 0 to 19 year olds fell by 15.5 %.
While according to the most recent projections [5] the number of older persons is expected to grow rapidly, particularly in the age group 80 years or over, the population aged 20 to 64 years will start shrinking in the next few years as more baby boomers enter their 60s and retire. As a result, the population aged 20 to 64 years is expected to gradually decline from 61.1 % in 2012 to 59.2 % in 2020, a reduction of 3.5 million people. At the same time, the number of older persons aged 65 or over will grow by 14 million, reaching 20.2 % of the total population in 2020.
Figure 1.6 shows how the baby boomer generation has moved up the age pyramid since 1990. This generation is the result of high fertility rates in several European countries over a 20 to 30 year period up to the mid-1960s. Baby boomers continue to comprise a significant part of the working population; however, the first of these large cohorts are now reaching retirement age. As a result of these demographic changes the old-age dependency ratio has increased from 23.1 % in 1990 to 29.1 % in 2012. This ratio shows the share of the population aged 65 and above compared with the population of 20 to 64 year olds. This means that while there were 4.3 persons of working age for every dependent person over 65 in the EU in 1990, this number fell to 3.4 persons by 2012. By 2020, the old-age dependency ratio is projected to increase to 34.1 %, meaning fewer than three persons of working age for every dependent person over 65 [6]. These trends underline the importance of maximising the use of the EU’s labour potential by raising the employment rate for men and women over the coming year. To meet labour market needs in a sustainable way, efforts are needed to help people stay in work for longer. Attention in particular needs to be given to women, older workers and young people. With regard to young people, it is important to help them find work as soon as they leave education, and ensure they remain employed.
Low activity rates of women and older workers result in low employment rates
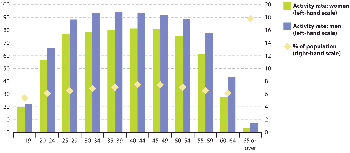
Not all people are economically active, as shown in Figure 1.2. This also concerns part of the population aged 20 to 64 years. Figure 1.7 shows the differences in activity rates between the sexes and across age groups. It compares these with the share of the respective age group (men and women together) in the total population.
Activity rates in the EU are consistently higher for men than for women and are generally highest for people aged 30 to 49. The main reason why men and women around 20 years of age do not seek employment is because they are participating in education or training. In 2012, this was the case for about 90 % of the inactive population aged 15 to 24. On the other hand, people aged 50 or over slowly start dropping out of the labour market because of poor health or retirement. The low activity rates of 15 to 19 year olds due to participation in education or training support the decision to raise the lower age limit for the strategy’s employment target from 15 to 20 years of age.
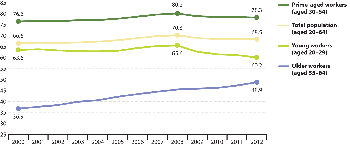
Employment rates of women and older workers have risen more or less continuously over the past decade. Between 2000 and 2012, the employment rate of 55 to 64 year olds rose by 12 percentage points. Growth was even more pronounced for women, at 14.4 percentage points. These increases have contributed to an overall growth in the EU employment rate. Due to the demographic changes facing the EU, older workers are working more. As baby boomers with high activity and employment rates move up the age pyramid, they eventually enter the 55 to 64 age group, pushing up the employment levels of older workers.
This development is also apparent in the increase in the duration of working life. This is measured as the number of years a person aged 15 is expected to be active in the labour market. Over the past decade, the duration of working life in the EU has risen by 1.8 years, from 32.9 years in 2000 to 34.7 years in 2011. The increase was higher for women (+ 2.7 years) than for men (+ 1 year). However, in 2011 men could still expect to stay in work much longer (37.4 years) than women (31.9 years).
This reaffirms the focus Europe 2020 puts on 55 to 64 year old women to boost progress towards raising the overall employment rate. Extending the working life for men and women — and by doing so increasing the employment rate of older workers — is generally considered ‘the most productive and promising answer to the demographic challenge of structural longevity’ [7]. ‘A longer working life will both support the sustainability and the adequacy of pensions, as well as bring growth and general welfare gains for an economy. Higher employment rates among older workers are also a precondition for the EU’s ability to reach the 2020 target, just as adequate pension systems are a precondition for the achievement of the poverty reduction ¬target’ [8].
Parenthood lowers employment rates of women
Parenthood is one of the main factors underlying gender activity and employment gaps. Because women are more often involved in childcare, parenthood is more likely to have an impact on their employment rates than on those for men, especially when care services are lacking or are too expensive.
Indeed, the lower activity rates for women aged 25 to 49 years compared with men (see Figure 1.7) are a result of women staying at home for childcare (37.8 % in 2012) and other family or personal responsibilities such as marriage, pregnancy or long vacation (17.2 % in 2012) [9]. In contrast, the main reasons why 25 to 49 year old men did not seek employment in 2012 were illness or disability (35.9 %) and participation in education or training (21.4 %).
The longer women are out of the labour market or are unemployed, notably due to care duties, the more difficult it will be for them to find a job in the long term. The gender employment gap, showing the difference in employment rates of men and women, is highest for 30 to 39 year olds and for the older cohort, as shown in Figure 1.9.
European employment policies are addressing the specific situation of women to help raise their activity and employment rates in line with the headline target, see Data sources and availability.
Older workers are most likely to remain long-term unemployed
Long-term unemployment describes people aged 15 or over who have been unemployed for longer than a year. These people usually find it harder to obtain a job than those unemployed for shorter periods, so they face a higher risk of social exclusion. Data on long-term unemployment are presented in the chapter Europe 2020 indicators - poverty and social exclusion.
Here, the focus is put on the difficulties unemployed people face in escaping their situation. Figure 1.10 shows the unemployed and long-term unemployed as a proportion of the economically active population for different age groups.
Unemployed older workers find it harder to escape unemployment [10]. More than half of those unemployed in this age group were long-term unemployed in 2012.
Migrants — a way to balance the ageing population structure
Economic migration is increasingly acquiring strategic importance for the EU in dealing with a shrinking labour force and expected skills shortages. Without net migration, the working-age population is estimated to shrink by 12 % in 2030 and by 33 % in 2060 compared with 2009 levels [11].
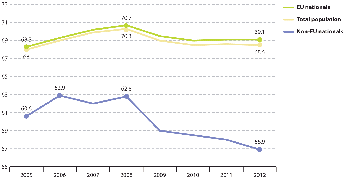
In 2012, non-EU citizens accounted for 4.0 % of the total LFS population [12]. Their share in the labour force was even higher, at 4.5 %. However, migrant workers do not only often occupy low-skilled, low-quality jobs, they also show considerably lower employment rates than EU citizens, as shown in Figure 1.11.
In 2012, the employment rate of non-EU nationals aged 20 to 64 was 11.6 percentage points below the total employment rate and 12.2 percentage points below that of EU nationals.
Better educational attainment increases employability
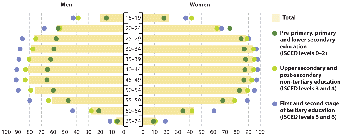
Educational attainment levels are another important factor for explaining the variation in activity and employment rates between different groups in the labour force. Figure 1.12 shows that activity rates are generally higher for higher educated people. In 2012, almost all 30 to 49 year old men with upper secondary or tertiary education were economically active.
There is a persistent gap in activity rates for 25 to 64 year olds between the lowest (pre-primary, primary or lower secondary education) and the two higher educational levels (upper secondary or tertiary education). This gap is particularly large for women. In 2012, activity rates for women with at most lower secondary education were about 30 percentage points below those who had attained tertiary education.
Employment rates are generally higher for people with better education levels. In 2012, people who had completed tertiary education had a significantly higher employment rate than the EU average, at 81.9 %. In contrast, just slightly more than half (52.2 %) of those with at most primary or lower secondary education were employed. The rate for workers with upper secondary or post-secondary non-tertiary education was in between these levels, at 69.7 %, slightly above the EU average. These findings underline the importance of education not only for people’s participation in the labour market, but also for their employability.
Increasing educational attainment and equipping people with skills for the knowledge society are therefore major concerns for European employment policies addressing the Europe 2020 headline targets on both employment and education, see Data sources and availability and the chapter Europe 2020 indicators - education.
As with employment, a clear link exists between unemployment and education: unemployment rates are generally lower for people with better education levels. In 2012, unemployment among those aged 15 to 74 with tertiary education was 6.1 %. This was significantly lower than the EU average of 10.4 %. In contrast, it was considerably higher for those with at most lower secondary education, at 18.2 %.
Young people who have completed only lower secondary education (early leavers from education and training; see the ‘Education’ chapter on p. 93) bear the highest risk of unemployment. Their unemployment rate reached more than 30 % in 2012.
In the context of the Europe 2020 strategy, it is important that young people maximise their professional working lives by engaging in employment as soon as possible and staying employed.
Labour demand
How does the cyclical development of the economy influence employment and unemployment?
Employment (and unemployment) rates are closely linked to the business cycle. Usually this is expressed in terms of GDP growth, which can be seen as a measure of an economy’s dynamism and its capacity to create new jobs. This relationship is illustrated by Figure 1.13. It shows similar patterns for GDP growth, employment growth and the share of newly employed people in total employment (people who started their job within the past 12 months).
The situation observable in 2010 and 2011, with GDP growth picking up but employment recovery more or less stalled, can be described as ‘jobless growth’. This means growth in GDP corresponding mostly to an increase in productivity and hours worked, leaving little room for employment growth [13]. As the result of another GDP contraction following the slight recovery in 2010 and 2011, the number of employed people fell again in 2012.
The link between GDP growth and employment growth is also reflected in the share of newly employed people as a share of total employment, which in 2009 dropped to the lowest level of the decade. It has since risen slightly, but has remained below pre-crisis levels. The overall favourable trend observable since 2000 in relation to employment and unemployment has been reversed by the economic crisis, with unemployment rates rising to above pre-crisis levels by 2012.
The crisis had a bigger impact on sectors dominated by male workers, such as construction and manufacturing, which led to men accounting for more than 80 % of the decline in employment between 2008 and 2010 in the EU [14].
Recessions tend to hit younger workers especially hard. Since the onset of the crisis in 2008, the employment rate of young people aged 20 to 29 has dropped by 5.4 percentage points. This reflects their generally weaker ‘attachment’ to the labour market. They are more likely to be in non-permanent contracts (see the analysis on ‘temporary contracts’ below) and are more vulnerable to applications of ‘last-in, first-out’ redundancy policies [15]. In contrast, employment among older workers aged 55 to 64, in particular women, has grown continuously since 2000, by 12 percentage points by 2012.
Looking at educational attainment, employment rates for all three subgroups have generally followed the overall EU trend before and after the crisis. Workers with the lowest education levels, however, were hardest hit, experiencing a 4.9 percentage points fall between 2007 and 2012. Similarly, migrants were especially affected by the crisis, being among the first to lose their jobs. Since 2008, the share of non-EU nationals aged 20 to 64 in work has fallen by 5.9 percentage points. In comparison, employment of EU nationals of the same age has fallen by only 1.6 percentage points.
Temporary contracts as adjustment variable for companies during crises
Fluctuations in the number of jobs in the EU since the crisis have been driven mainly by part-time work and temporary (short-term) contracts. In particular temporary contracts proved to be a major adjustment variable for companies. These have been the most reactive segment of the labour market since the crisis first broke out [16].
The proportion of the EU labour force working on a fixed-term contract has risen steadily since 2001. Temporary employment in the EU was most widespread among young workers, with 42.1 % of 15 to 24 year olds working on a time-limited contract in 2012. The rate of temporary employment was much lower for 20 to 64 year olds at 12.8 % and for older workers aged 55 to 64 at 6.6 % in the same year. However, it also needs to be considered that some workers prefer fixed-term contracts over permanent ones. Involuntary temporary employment therefore provides a better insight into the over-use of fixed-term contracts.
In 2012, 8.3 % of employed 20 to 64 year olds were involuntarily working on temporary contracts. Despite some fluctuations, the overall trend since 2001 indicates growing use of involuntary fixed-term contracts. This development can be seen in the light of recent labour market policies implemented across the EU. These aim to replace traditional job protection with measures enhancing the employability of labour market outsiders while easing hiring and lay-off procedures [17].
The increase in temporary contracts and other non-standard forms of employment, in particular for newly created jobs, is a signal for increasing fluidity in the labour market. This is making it easier for firms to adapt labour input to new forms of production and work organisation [18].
Job vacancies as an indicator of unmet labour demand
Job vacancy statistics provide an insight into the demand side of the labour market, in particular on unmet labour demand. A job vacancy is defined as a paid post that is newly created, unoccupied or about to become vacant, for which the employer is taking active steps and is prepared to take further steps to find a suitable candidate from outside the enterprise concerned, and which the employer intends to fill either immediately or within a specific period of time. A vacant post that is only open to internal candidates is not treated as a ‘job vacancy’.
Quarterly job vacancy statistics are used for business cycle analysis and assessing mis-matches on labour markets. Of particular interest is the relationship between vacancies and unemployment, the so-called Beveridge curve. The curve reflects the negative relationship between vacancies and unemployment. During economic contractions, there are few vacancies and high unemployment while during expansions there are more vacancies and the unemployment rate is low.
Structural changes in the economy can generate shifts in the Beveridge curve. Concurrent increases in the vacancy and unemployment rates can be identified at times of uneven growth across regions or industries when the matching efficiency between labour supply and demand decreases. Concurrent decreases can be observed when the matching efficiency of the labour market improves. This could be, for example, due to a better flow of information on job vacancies thanks to the internet. The empirical analysis of the curve can be challenging as both movements along the curve and shifts might be taking place at the same time with different intensities.
Data for the period 2008 to 2009 show a movement along the Beveridge curve, mirroring the impacts of the economic crisis on job vacancies and unemployment. Since 2010, however, movements of the Beveridge curve itself point to a possibly substantial deterioration in the matching process: unemployment is growing, while the job vacancy rate remains stable. This indicates that unemployment has become more structural over the past two years [19].
EU policies in the area of job vacancies aim to improve the functioning of the labour market by trying to more closely match supply and demand, see Data sources and availability.
Conclusions and outlook towards 2020
Between 2000 and 2008, the EU employment rate for the age group 20 to 64 rose by 3.7 percentage points, from 66.6 % in 2000 to 70.3 % in 2008. This growth was visible throughout different groups in the labour force, such as men, women, older and younger people, high- and low-skilled workers as well as migrants. Starting from rather low employment levels of 36.9 % in 2000, employment growth was most pronounced for older workers aged 55 to 64 years. Similarly, employment rates for women grew faster than for men, reducing the gender employment gap.
Mirroring these trends, unemployment rates declined over the period 2000 to 2008, with 7.0 % of economically active 15 to 74 year olds unemployed in 2008. However, despite a considerable fall by 2.7 percentage points between 2000 and 2008, young people aged 15 to 24 still had unemployment rates twice as high as the overall unemployment rate.
As a result of the EU economy contracting by 4.5 % in 2009 due to the economic crisis, employment levels fell and unemployment in turn rose up to 2012. The reduction in employment rates over recent years has most affected young people aged 15 to 24, workers with low education levels and non-EU nationals.
The youth unemployment rate increased to 22.8 % in 2012 and, more recently, has continued to reach new highs in 2013. Similarly, unemployment levels of low-skilled people have increased by 7.6 percentage points since 2007, reaching 18.2 % in 2012. Low-educated young people are clearly the worst off, with their unemployment rate climbing to 30.3 % in 2012, which is more than 10 percentage points higher than in 2007.
Temporary contracts are one reason why young people are more vulnerable to economic disruptions. Fluctuations in EU job numbers since the crisis have been mainly driven by part-time work and fixed-term contracts. In 2012 about 42 % of 15 to 24 year olds worked on time-limited contracts, although 15.4 % of those would actually prefer to work on a permanent contract. Additionally, data on job vacancies point to a possible deterioration in the job matching process, with unemployment increasing while job vacancies remain stable.
The economic crisis thus highlighted some of the most vulnerable groups (young people, migrants, low-skilled) that need to be addressed in view of the Europe 2020 strategy’s ‘inclusive growth’ priority. Additionally, women, especially those aged 55 to 64 years, and older workers in general still have considerably lower employment rates than other groups in the labour force. This puts these labour market groups in the spotlight for making progress towards the overall EU and national employment targets [20].
Additionally, long-term changes in the demographic structure of the EU population add to the necessity of increasing the EU’s employment rate. Despite a growing population, low fertility rates combined with continuous rises in life expectancy are predicted to lead to a shrinking EU labour force. Increases in the employment rate are therefore necessary to compensate for the expected decline in the working-age population by 3.5 million people by 2020.
Efforts needed to meet the Europe 2020 target on employment
Overall, in 2012 the EU was 6.5 percentage points below its target value of 75 %, to be met by 2020. As only marginal increases are expected for 2013 and 2014, reaching the Europe 2020 target will require considerable effort. An extra 17.6 million people will need to enter employment, taking into account the expected working-age population in 2020. Four groups can be expected to deliver the biggest hypothetical gains with respect to increasing the overall employment rate, taking into account their respective share in the population and their current employment and unemployment levels: prime-age women, women aged 55 to 64, the low-skilled generally and, to a lesser extent, prime-age and older men [21].
Data sources and availability
What is meant by ‘labour force’, ‘activity’, ‘employment’ and ‘un-employment’?
The term ‘labour force’ refers to the economically active population. This is the total number of employed and unemployed persons. People are classified as employed, unemployed and economically inactive according to the definitions of the International Labour Organisation (ILO) [22]. On an EU level the two main sources for this data are the EU Labour Force Survey (EU LFS) [23] and National Accounts [24].
The LFS is a large sample survey among private households, excluding the population living in institutional households (such as workers’ homes or prisons). Respondents are classified as em-ployed, unemployed or economically inactive based on information collected through the survey questionnaire, which mainly relates to their actual activity during a particular reference week. The EU LFS data refer to the resident population and therefore the results relate to the country of resi-dence of persons in employment, rather than to the country of work. This difference may be significant in countries with large cross-border flows.
According to the definitions:
The economically active population, as already mentioned, is the sum of employed and unem-ployed persons. Inactive ¬persons are those who, during the reference week, were neither em-ployed nor unemployed.
- The activity rate is the share of the population that is economically active.
- Economic activity is measured only for persons aged 15 years or older, because this is the earliest that a person can leave full-time compulsory education in the EU [25]. Many Member States have also made 15 the minimum employment age [26].
Persons in employment are those who, during the reference week, did any work for pay or profit, or were not working but had a job from which they were temporarily absent. ‘Work’ means any work for pay or profit during the reference week, even for as little as one hour. Pay includes cash payments or payment in kind (payment in goods or services rather than money), whether payment was received in the week the work was done or not. Anyone who receives a wage for on-the-job training that involves the production of goods or services is considered as being in employment. Self-employed and family workers are also included.
- Employment rates represent employed persons, as a percentage of the same age population; they are frequently broken down by sex and different age groups.
- For the employment rates, data most often refer to persons aged 15 to 64. But in the course of setting the Europe 2020 strategy’s employment target, the lower age limit has been raised to 20 years. One reason was to ensure compatibility with the strategy’s headline targets on education (see chapter on ‘Education’ on page 93), in particular the one for tertiary educa-tion [27]. The upper age limit for the employment rate is usually set to 64 years, taking into account statutory retirement ages across Europe [28]. However, the possibility of raising the upper age limit for the employment rate is under ¬discussion [29].
Unemployed persons comprise persons aged 15 to 74 who were:
- without work during the reference week, i.e. neither had a job nor were at work (for one hour or more) in paid employment or self-employment;
- available to start work, i.e. were available for paid employment or self-employment before the end of the two weeks following the reference week;
- actively seeking work, i.e. had taken specific steps in the four-week period ending with the reference week to seek paid employment or self-employment or who found a job to start within a period of at most three months.
- The unemployment rate is the number of unemployed persons as a percentage of the labour force (the total number of people employed and unemployed);
- The youth unemployment rate is the unemployment rate of people aged 15 to 24;
- The long-term unemployment rate is the number of persons unemployed for 12 months or longer as a percentage of the labour force.
- To take into account persons that would like to (or have to) work after the age of 64 but are un-able to find a job, the upper age limit for the unemployment rate is usually set to 74 years of age. As a result, the observed age group for unemployed persons is 15 to 74 years.
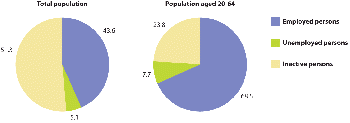
Figure 1.2 shows the distribution of employed, unemployed and inactive persons for the total population [30] and for the population aged 20 to 64 years. The latter shows the working-age population addressed by the Europe 2020 strategy’s employment target.
In 2012, less than half of the total LFS population of 495 million people [31] was economically active. The 254 million inactive people include children and retired people. For labour market analyses, the focus is therefore put on persons aged 20 to 64. In 2012, more than three-quarters of people aged 20 to 64 (303 million people) were economically active, 208 million people (68.5 % of the population age group 20 to 64) were employed and 23 million were unemployed (7.7 % of the same age group, equalling a share of 10.1 % of the economically active population 20 to 64 years old). ‘Only’ 72 million people aged 20 to 64 were economically inactive, compared with 254 million people from the total population.
Based on these data, the following indicators are usually calculated for analysing labour market trends:
- Activity rate: in 2012, 48.7 % of the total population or 76.2 % of the population aged 20 to 64 years were active on the labour market.
- Employment rate: in 2012, 43.6 % of the total population or 68.5 % of the population aged 20 to 64 years were employed.
- Unemployment rate: in 2012, the unemployment rate was slightly above 10 % for both the total and the population aged 20 to 64.
Employment policies specifically targeting the situation of women
One of the priorities of the flagship initiative ‘An Agenda for new skills and jobs’ is to create new momentum for flexicurity policies aimed at modernising labour markets and promoting work through new forms of flexibility and security. Under the flexibility component, ‘Flexible and reliable contractual arrangements’, the flagship initiative calls for ‘putting greater weight on internal flexibility in times of economic downturn’: ‘Flexibility also allows men and women to combine work and care commitments, enhancing in particular the contribution of women to the formal economy and to growth, through paid work outside the home.’ [32]
The security component is addressed by the EU employment package ‘Towards a job-rich recovery’ under its objective of restoring the dynamics of labour markets. This calls for ‘security in employment transitions’, such as the transition from maternity leave to employment: ‘the integration of women in the labour market [deserves particular attention], by providing equal pay, adequate childcare, eliminating all discrimination and tax-benefit disincentives that discourage female participation, and optimising the duration of maternity and parental leave.’ [33]
Employment policies addressing migration
‘In the longer term, and especially in view of the EU’s demographic development, economic immigration by third-country nationals is a key consideration for the EU labour market’ [34]. The EU employment package ‘Towards a job-rich recovery’ specifically addresses the relevance of migration for tackling expected skills shortages: ‘With labour needs in the most dynamic economic sectors set to rise significantly between now and 2020, while those in low-skills activities are set to decline further, there is a strong likelihood of deficits occurring in qualified job-specific skills’.
Employment policies and education
‘Improving the matching process between labour supply and demand by adapting educational and training systems to produce the skills required on the labour market is a key priority of the Europe 2020 strategy’s flagship initiative ‘An Agenda for new skills and jobs’. It proposes a bundle of measures aimed at strengthening the EU’s capacity to anticipate and match labour market and skill needs. These include labour market observatories bringing together labour market actors and education and training providers, measures enhancing geographical mobility throughout the EU, and actions towards better integration of migrants and better recognition of their skills and -qualifications (27).
Investing in skills is also a priority of the EU employment package ‘Towards a job-rich recovery’ . Under its objective of restoring the dynamics of labour markets, the European Commission calls for a better monitoring of skills needs and ‘a close cooperation between the worlds of education and work’
It also addresses youth employment, calling for ‘security in employment transitions’, such as the transition of young people from education to work. It also reaffirms the EU’s commitment to tackle the dramatic levels of youth unemployment, ‘by mobilising available EU funding’ and by supporting the transition to work ‘through youth guarantees, activation measures targeting young people, the quality of traineeships, and youth mobility’ [35].
The Europe 2020 flagship initiative ‘Youth on the Move’ emphasises that ‘youth unemployment is unacceptably high’ in the EU, and that ‘to reach the 75 % employment target for the population aged 20 to 64 years, the transition of young people to the labour market needs to be radically improved’. To this end, the flagship initiative focuses on four main lines of action including life-long learning activities, tackling early school leaving, promoting tertiary education and improving learning mobility. Additionally, the flagship initiative calls for urgently improving the employment situation of young people, by taking actions towards facilitating the transition from school to work and reducing labour market segmentation [36].
Context
Employment — why does it matter?
Employment and other labour market-related issues are at the heart of the social and political debate in the EU. Paid employment is crucial for ensuring sufficient living standards and it provides the necessary base for people to achieve their personal goals and aspirations. Moreover, employment contributes to economic performance, quality of life and social inclusion, making it one of the cornerstones of socioeconomic development and well-being.
The EU’s workforce is shrinking as a result of demographic changes. A smaller number of workers are thus supporting a growing number of dependent people. This is putting at risk the sustainability of Europe’s social model, welfare systems, economic growth and public finances. In addition, steady gains in economic growth and job creation over the past decade have been wiped out by the recent economic crisis, exposing structural weaknesses in the EU’s economy. At the same time, global challenges are intensifying and competition from developed and emerging economies such as China or India is increasing [37].
To face the challenges of an ageing population and rising global competition, the EU needs to make full use of its labour potential. The Europe 2020 strategy, through its ‘inclusive growth’ priority, has placed a strong emphasis on job creation. One of its five headline targets addresses employment, with the aim of raising the employment rate of 20 to 64 year olds to 75 % by 2020. This goal is supported by the so-called ‘Employment ¬Package’ [38], which seeks to create more and better jobs throughout the EU.
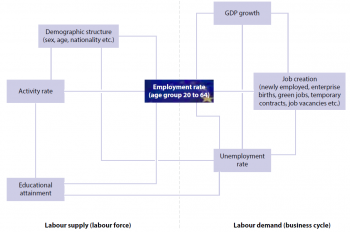
The chapter analyses the headline indicator ‘Employment rate — age group 20 to 64’, chosen to monitor the employment target. Contextual indicators are used to present a broader picture, looking into the drivers behind the changes in the headline indicator. These include indicators from both the supply and demand side of the labour market, as shown in Figure 1.1
Concerning labour supply, the analysis investigates the structure of the EU’s labour force and its long-term influence on employment in relation to the strategy’s main target groups: women, young, older and low-skilled people and migrants. These groups are considered important because of their rather low employment rates. Boosting employment within them would hypothetically bring the biggest gains with respect to increasing the overall employment rate [39].
The analysis then shifts to short-term, demand-oriented factors related to the cyclical development of the economy (as expressed through GDP growth) such as job vacancies, and how this influences job creation, temporary employment and unemployment.
The EU’s employment target is closely interlinked with the other strategy goals on research and development (R&D) (see 'greener, more inclusive - research and development Research and Development' chapter), climate change and energy (see 'greener, more inclusive - climate change and energy Climate Change and Energy' chapter), education (see 'greener, more inclusive - education Education' chapter) and poverty and social exclusion (see 'greener, more inclusive - poverty and social exclusion Poverty and Social Exclusion' chapter). Progress towards one target therefore also depends on how the other targets are addressed. Better educational levels help employability and higher employment rates in turn help reduce poverty. Moreover, greater R&D capacity, together with increased resource efficiency, will improve competitiveness and contribute to job creation. The same is true for investing in energy efficiency measures and boosting renewable energies [40].
Europe 2020 strategy target on employment
The Europe 2020 strategy sets out a target of ‘aiming to raise to 75 % the employment rate for women and men aged 20 to 64, including through the greater participation of young people, older workers and low-skilled workers and the better integration of legal migrants’, to be achieved by 2020 [41].
Further Eurostat information
Data visualisation
- Regional Statistics Illustrated - select statistical domain 'xxx' (= Agriculture, Economy, Education, Health, Information society, Labour market, Population, Science and technology, Tourism or Transport) (top right)
Publications
Main tables
Database
- Title(s) of second level folder (if any)
- Title(s) of third level folder (if any)
Dedicated section
Europe 2020 headline indicators
Methodology / Metadata
<link to ESMS file, methodological publications, survey manuals, etc.>
- Name of the destination ESMS metadata file (ESMS metadata file - ESMS code, e.g. bop_fats_esms)
- Title of the publication
Source data for tables, figures and maps (MS Excel)
Other information
<Regulations and other legal texts, communications from the Commission, administrative notes, Policy documents, …>
- Regulation 1737/2005 (generating url [http://eur-lex.europa.eu/LexUriServ/LexUriServ.do?uri=CELEX:32005R1737:EN:NOT Regulation 1737/2005]) of DD Month YYYY on ...
- Directive 2003/86/EC (generating url [http://eur-lex.europa.eu/LexUriServ/LexUriServ.do?uri=CELEX:32003L0086:EN:NOT Directive 2003/86/EC]) of DD Month YYYY on ...
- Commission Decision 2003/86/EC (generating url [http://eur-lex.europa.eu/LexUriServ/LexUriServ.do?uri=CELEX:32003D0086:EN:NOT Commission Decision 2003/86/EC]) of DD Month YYYY on ...
<For other documents such as Commission Proposals or Reports, see EUR-Lex search by natural number>
<For linking to database table, otherwise remove: {{{title}}} ({{{code}}})>
External links
See also
Notes
- ↑ European Commission, Europe 2020 — A strategy for smart, sustainable and inclusive growth, COM(2010) 2020 final, Brussels, 2010 (p. 5, 7, 17), European Commission, An Agenda for new skills and jobs: A European contribution towards full employment, COM(2010) 682 final, Strasbourg, 2010 (p. 2) and European Commission, Europe 2020 targets: employment rate target (accessed 22 July 2013).
- ↑ See http://ec.europa.eu/europe2020/pdf/targets_en.pdf.
- ↑ European Commission (Directorate-General for Employment, Social Affairs and Inclusion &amp;amp;amp;amp;amp;amp;amp;amp; Eurostat), Demography Report 2010 — Older, more numerous and diverse Europeans, Luxembourg: Publications Office of the European Union, 2011 (p. 59).
- ↑ Please note that the total population figures presented here differ from the population concept used in the EU LFS, which only covers resident persons living in private households, excluding the population living in institutional households (such as workers’ homes or prisons). The data are based on Eurostat data tables demo_pjangroup and proj_10c2150p.
- ↑ EUROPOP 2010 convergence scenario; see http://epp.eurostat.ec.europa.eu/statistics_explained/index.php/Population_projections.
- ↑ EUROPOP 2010 convergence scenario; see http://epp.eurostat.ec.europa.eu/statistics_explained/index.php/Population_projections.
- ↑ European Commission (Directorate-General for Employment, Social Affairs and Inclusion), Employment and Social Developments in Europe 2012, Luxembourg: Publications Office of the European Union, 2012 (p. 57).
- ↑ See footnote 19 above; the Europe 2020 headline target concerning the reduction of the number of people at risk of poverty or social exclusion is described in the corresponding chapter ‘Poverty and social exclusion’ on page 125.
- ↑ Eurostat, EU Labour Force Survey – explanatory notes, Luxembourg, 2011 (p. 80).
- ↑ European Commission (Directorate-General for Employment, Social Affairs and Inclusion), Employment and Social Developments in Europe 2012, Luxembourg: Publications Office of the European Union, 2012 (p. 124).
- ↑ European Commission, An Agenda for new skills and jobs: A European contribution towards full employment, COM(2010) 682 final, Strasbourg, 2010 (p. 9).
- ↑ The target population of the EU LFS are resident persons living in private households, excluding the population living in institutional households (such as workers’ homes or prisons).
- ↑ European Commission (Directorate-General for Employment, Social Affairs and Inclusion), Employment and Social Developments in Europe 2012, Luxembourg: Publications Office of the European Union, 2012 (p. 19).
- ↑ European Commission (Directorate-General for Employment, Social Affairs and Inclusion), Employment and Social Developments in Europe 2011, Luxembourg: Publications Office of the European Union, 2012 (p. 47).
- ↑ European Commission (Directorate-General for Employment, Social Affairs and Inclusion), Employment and Social Developments in Europe 2011, Luxembourg: Publications Office of the European Union, 2012 (p. 48).
- ↑ European Commission (Directorate-General for Employment, Social Affairs and Inclusion), Employment and Social Developments in Europe 2012, Luxembourg: Publications Office of the European Union, 2012 (p. 31).
- ↑ European Commission (Directorate-General for Employment, Social Affairs and Inclusion), Employment and Social Developments in Europe 2012, Luxembourg: Publications Office of the European Union, 2012 (p. 54).
- ↑ European Commission, Towards a job-rich recovery, COM(2012) 173 final, Strasbourg, 2012 (p. 10).
- ↑ European Commission (Directorate-General for Employment, Social Affairs and Inclusion), Employment and Social Developments in Europe 2012, Luxembourg: Publications Office of the European Union, 2012 (p. 29).
- ↑ European Commission, Europe 2020 targets: employment rate target (accessed 22 July 2013).
- ↑ European Commission, Europe 2020 targets: employment rate target (accessed 22 July 2013).
- ↑ For more information see the ILO website: http://www.ilo.org/global/lang--en/index.htm.
- ↑ For more information on the EU LFS, see: http://epp.eurostat.ec.europa.eu/portal/page/portal/employment_unemployment_lfs/introduction.
- ↑ For more information see: http://epp.eurostat.ec.europa.eu/portal/page/portal/national_accounts/introduction.
- ↑ João Medeiros &amp;amp;amp;amp;amp;amp;amp;amp;amp;amp;amp;amp; Paul Minty, Analytical support in the setting of EU employment rate targets for 2020, Working Paper 1/2012, Brussels: European Commission (Directorate-General for Employment, Social Affairs &amp;amp;amp;amp;amp;amp;amp;amp;amp;amp;amp;amp; Inclusion), 2012 (p. 58).
- ↑ European Commission (Directorate-General for Justice), Age and Employment, Luxembourg: Publications Office of the European Union, 2011 (p. 50).
- ↑ João Medeiros &amp;amp;amp;amp;amp;amp;amp;amp;amp;amp;amp;amp; Paul Minty, Analytical support in the setting of EU employment rate targets for 2020, Working Paper 1/2012, Brussels: European Commission (Directorate-General for Employment, Social Affairs &amp;amp;amp;amp;amp;amp;amp;amp;amp;amp;amp;amp; Inclusion), 2012 (p. 12).
- ↑ European Commission (Directorate-General for Economic and Financial Affairs), The 2012 Ageing Report: Economic and budgetary projections for the EU27 Member States (2010–2060), 2012 (p. 99).
- ↑ João Medeiros &amp;amp;amp;amp;amp;amp;amp;amp;amp;amp;amp;amp; Paul Minty, Analytical support in the setting of EU employment rate targets for 2020, Working Paper 1/2012, Brussels: European Commission (Directorate-General for Employment, Social Affairs &amp;amp;amp;amp;amp;amp;amp;amp;amp;amp;amp;amp; Inclusion), 2012 (p. 15).
- ↑ The target population of the EU LFS are resident persons living in private households, excluding the population living in institutional households (such as workers’ homes or prisons).
- ↑ The target population of the EU LFS are resident persons living in private households, excluding the population living in institutional households (such as workers’ homes or prisons).
- ↑ European Commission, An agenda for new skills and jobs: A European contribution towards full employment, COM(2010) 682 final, Strasbourg, 2010 (p. 5).
- ↑ European Commission, Towards a job-rich recovery, COM(2012) 173 final, Strasbourg, 2012 (p. 10).
- ↑ European Commission, Towards a job-rich recovery, COM(2012) 173 final, Strasbourg, 2012 (p. 18).
- ↑ European Commission, Towards a job-rich recovery, COM(2012) 173 final, Strasbourg, 2012 (p. 10).
- ↑ European Commission, Youth on the move: An initiative to unleash the potential of young people to achieve smart, sustainable and inclusive growth in the European Union, COM(2010) 477 final, Brussels, 2010 (p. 3).
- ↑ European Commission, Europe 2020 — A strategy for smart, sustainable and inclusive growth, COM(2010) 2020 final, Brussels, 2010 (p. 5, 7, 17), European Commission, An Agenda for new skills and jobs: A European contribution towards full employment, COM(2010) 682 final, Strasbourg, 2010 (p. 2) and European Commission, Europe 2020 targets: employment rate target (accessed 22 July 2013).
- ↑ European Commission, Towards a job-rich recovery, COM(2012) 173 final, Strasbourg, 2012.
- ↑ European Commission, Europe 2020 targets: employment rate target (accessed 22 July 2013).
- ↑ European Commission, Europe 2020 — A strategy for smart, sustainable and inclusive growth, COM(2010) 2020 final, Brussels, 2010 (p. 11).
- ↑ European Council conclusions 17 June 2010, EUCO 13/10, Brussels, 2010.
[[Category<Subtheme category name(s)>|Europe 2020 indicators - employment]] [[Category:<Statistical article>|Europe 2020 indicators - employment]]
