Archive:Freight transport statistics
- Data from September 2008, most recent data: Further Eurostat information, Main tables and Database.
The ability to move goods safely, quickly and cost-efficiently to market is important for international trade, national distributive trades, and economic development.This article presents the main European Union (EU) data on freight transport including transport by road, rail, air, maritime and inland waterways. Growth in freight transport across Europe largely reflects the growth in GDP in the various Member States.
Strains on infrastructure, demonstrated by congestion and delays, as well as the constraints of disparate standards, technical barriers, poor interoperability and governance can all impact on economic development.
Main statistical findings
The volume of inland freight transport in the EU has changed roughly in line with the change in GDP since 1996 (see Table 1). Relative to growth in GDP, Portugal recorded the most dramatic growth in the volume of inland freight transport during this period, followed by Spain, Bulgaria, Estonia and Ireland, while Romania recorded even stronger growth during the period from 1999 to 2006. In contrast, the change in GDP exceeded the change in the volume of inland freight transport by the greatest extent in Slovakia, followed by Cyprus and Denmark.
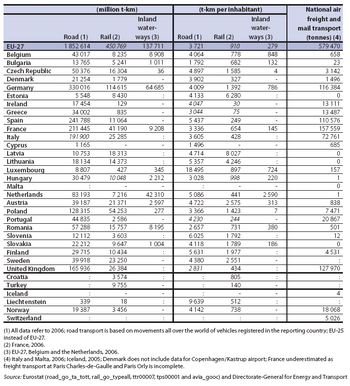
Table 2 shows that Estonia and Latvia were the only Member States where a greater volume of freight was transported by rail than by road, while Belgium and the Netherlands were the only Member States where a greater volume of freight was transported by inland waterways than by rail. Relative to the size of the population, the greatest volume of road freight transport was reported by Luxembourg, over 18 000 tonne-km per inhabitant, more than three times the next highest volume which was recorded by Slovenia. In both cases, the majority of road freight recorded was undertaken outside the borders of these countries but by vehicles registered in them.
Air & sea
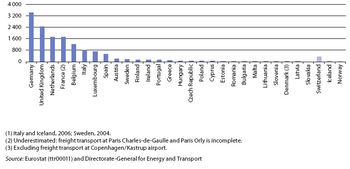
Less than 5 % of air freight and mail transport is national, totalling 579 470 tonnes during 2007 in the EU, with France accounting for the largest share (see Graph 1). In total, including national and international transport, 3.4 million tonnes of air freight was carried through German airports in 2007. Some of the smaller Member States are quite specialised in air freight services, especially all of the Benelux Member States, particularly Luxembourg.
In 2006, 3 834 million tonnes of goods were handled in EU maritime ports (3.2 % higher than in 2005). Graph 2 shows that with 584 million tonnes, the United Kingdom had the highest share (15 %) of goods handled in EU-27 ports, followed by Italy (14 %). Among the smaller Member States, the weight of goods handled in maritime ports was particularly high in Estonia, the Netherlands, Latvia, Finland, Belgium and Sweden.
Data sources and availability
The weight of goods transported by rail and inland waterways is the gross-gross weight of goods. This includes the total weight of the goods, all packaging, and tare-weight of the container, swap-body and pallets containing goods. In the case of rail transport, it also includes road goods vehicles carried by rail. The tare-weight is the weight of a transport unit before any cargo is loaded; when the tare-weight is excluded, the weight is the gross weight. The weight measured for sea and road freight transport is the gross weight.
Goods loaded are those goods placed on a road vehicle/railway vehicle/merchant ship and dispatched by road/rail/sea. Unlike for road and inland waterway transport, transhipments from one railway vehicle directly to another and change of tractor vehicle are not regarded as unloading/loading; however, if the goods are unloaded from one railway vehicle to another railway vehicle, this is considered as a break in the journey. Goods unloaded are those goods taken off a road vehicle/railway vehicle/merchant ship.
Road freight transport statistics are reported by Member States for vehicles registered in their country. On the basis of information on the reporting country, country of loading and country of unloading of a journey, five types of operations are derived:
- national transport;
- international transport – goods loaded in the reporting country;
- international transport – goods unloaded in the reporting country;
- international transport – cross-trade (transport between two countries by a vehicle registered in a third country);
- international transport – cabotage (transport inside one country by a vehicle registered in another country).
Rail freight data are provided to Eurostat in line with Regulation 91/2003; this Regulation has been implemented from 2004 onwards. Whereas the quarterly data concern railway enterprises under detailed reporting (usually the larger enterprises[1]), annual data cover all enterprises. Rail freight data are not available for Malta and Cyprus as they do not have a railway infrastructure. Switzerland will provide railway statistics starting from 2008 as a reference year, while Iceland has no railways.
Maritime transport data are available for most of the period from 2001 onwards, although some Member States have provided data for the period since 1997. Maritime transport data are not transmitted to Eurostat by the Czech Republic, Luxembourg, Hungary, Austria and Slovakia as they have no maritime ports.
Air freight and mail transport statistics are broken down by freight and mail on board (arrivals, departures and total), freight and mail loaded and unloaded and all-freight and mail commercial air flights (arrivals, departures and total). The data are presented with monthly, quarterly and annual frequencies. Annual data are available for most of the EU-27 Member States for the period from 2003, with a majority also providing data for 2001 and 2002, while some Member States have provided data back to 1993.
The volume of inland freight transport is defined as the ratio between tonne-km (inland modes) and GDP (gross domestic product in constant (2000) EUR), and within this article the ratio is indexed on 2000. Rail and inland waterways transport are based on movements on national territory, regardless of the nationality of the vehicle or vessel. Road transport is based on all movements of vehicles registered in the reporting country.
Context
The EU has already taken a number of steps to improve freight transport throughout the EU, but the mid-term review of the 2001 White paper specified further actions. The package of measures being proposed by the European Commission concern:
- A freight transport logistics action plan: this covers, among other ideas, e-freight and intelligent transport systems, the promotion of interoperability across modes, single transport documents and the removal of regulatory obstacles;
- A rail network giving priority to freight [2]. The ideas being proposed include:
- The creation of freight corridor structures to measure service quality
- Improvement of the infrastructure of existing freight corridors
- The introduction of harmonised rules for the allocation of train paths
- The development of priority rules in the case of traffic disturbance, and
- The improvement of terminal and marshalling yard capacities;
- A ports policy with the ideas being proposed including several that might be grouped under ’modernisation’ such as:
- The simplification of procedures for short-sea shipping
- An e-maritime approach to administration and improved port equipment, and
- The expansion of capacity whilst respecting the environment;
- A maritime and short-sea shipping policy [3] with challenges including:
- Reducing bureaucracy
- Improving promotion and marketing
- Ensuring the availability of suitable vessels
- Providing adequate training
- The availability of good quality hinterland connections, and
- Establishing integrated information systems.
Further Eurostat information
Publications
Main tables
- Transport, volume and modal split (t_tran_hv)
- Railway transport (t_rail)
- Road transport (t_road)
- Inland waterways (t_iww)
- Maritime transport (t_mar)
- Air transport (t_avia)
Database
- Regional transport statistics (tran_r)
- Transport, volume and modal split (tran_hv)
- Railway transport (rail)
- Road transport (road)
- Inland waterways transport (iww)
- Oil pipeline transport (pipe)
- Maritime transport (mar)
- Air transport (avia)
Dedicated section
Other information
External links
See also
Notes
- ↑ Countries may cover all railway undertakings operating on their national territory with detailed reporting only (irrespective of the undertaking’s transport performance). In this case, quarterly data are comparable with annual ones.
- ↑ Towards a rail network giving priority to freight COM(2007) 608.
- ↑ Commission Staff Working Document SEC(2007) 1367.


