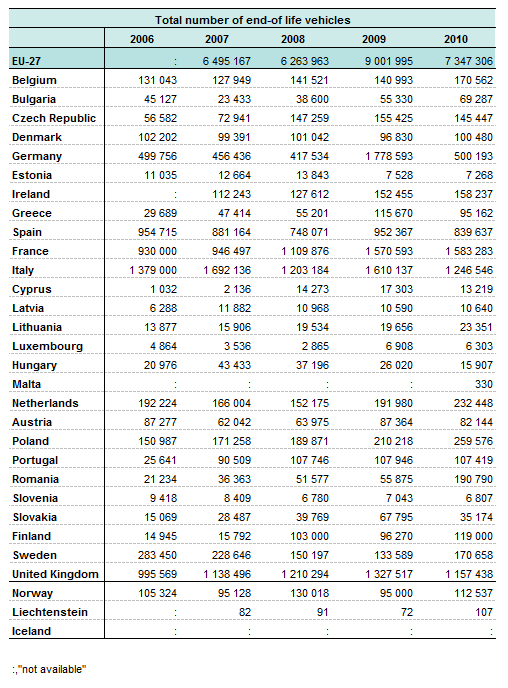
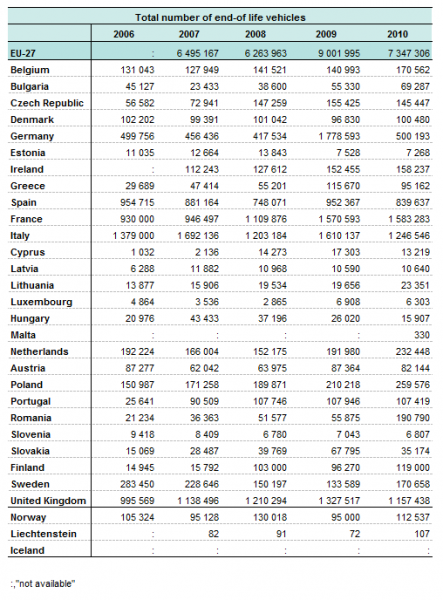
File:Total number of end of life vehicles ELV2006to2010.PNG
Original file (508 × 688 pixels, file size: 34 KB, MIME type: image/png)
End-of-life vehicle (ELV) statistics Data from March 2012, most recent data: Further Eurostat information, Main tables and Database.
The environmental impacts caused by the generation and treatment of waste are raising serious concerns. As waste generation also represents an inefficient use of valuable resources, prevention and better management of waste is one of the top priorities of the EU's sustainable development strategy <http://register.consilium.europa.eu/pdf/en/06/st10/st10117.en06.pdf>. Although the magnitude of the different waste streams varies across European countries, it is possible to identify waste streams that require specific consideration - such as end-of-life vehicles (ELV). This article provides background information to broaden the usability of the monitoring data on ELV. The Commission Decision 2005/293/EC <http://eur-lex.europa.eu/LexUriServ/LexUriServ.do?uri=OJ:L:2005:094:0030:0033:EN:PDF> on monitoring of the reuse/recovery and reuse/recycling targets for ELV enables different approaches to demonstrate that the targets are met. Thus not all detailed figures reported by the countries are directly comparable. However, different national characteristics become evident when analysing the data as demonstrated below. Other sources on the European vehicle stock have been used to estimate the coverage of ELV monitoring in EU-27. As a result, a remarkable number of ELV has not yet been covered by the monitoring system; this observation is supported by statements made by the countries in their quality reports.
File usage
There are no pages that use this file.