File:Specialisation of agrciultural holdings, EU-2, NO, CH, ME, 2010, SO.png
Revision as of 10:25, 12 August 2013 by Kremeak (talk | contribs) (uploaded a new version of "File:Specialisation of agrciultural holdings, EU-27, NO, CH, ME and HR, 2010, SO.png")

Size of this preview: 443 × 599 pixels. Other resolutions: 177 × 240 pixels | 637 × 862 pixels.
Original file (637 × 862 pixels, file size: 13 KB, MIME type: image/png)
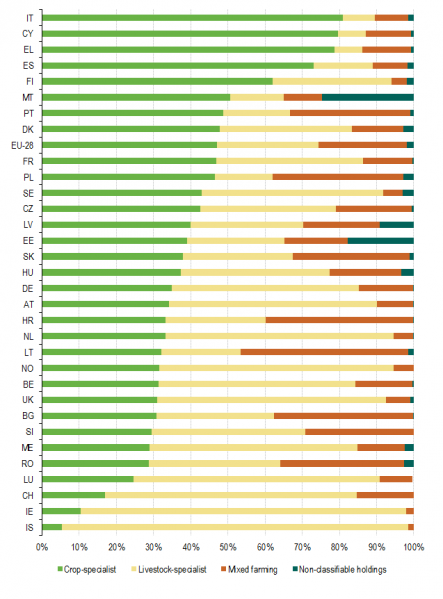
Specialisation of agrciultural holdings, EU-27, NO, CH, ME and HR, 2010, SO
Graph created with data from 2013
Data extracted at 23/01/2013, most recent data available now, see:
Data 2007 and 2010 estimated with Standard Output:
Data before 2010 estimated with Standard Gross Margin:
File usage
There are no pages that use this file.