Archive:Labour market policy expenditure
- Data from May 2013. Most recent data: Further Eurostat information, Main tables and Database.
This article analyses recent statistics on labour market policy expenditure in the European Union (EU). Labour market policy (LMP) interventions cover the range of financial and practical supports offered by governments to people who are unemployed or otherwise disadvantaged in the labour market. The recent economic and financial crisis has resulted in a significant increase in the number of people who are unemployed and therefore eligible for assistance from LMP interventions. As a result, expenditure on LMP has risen, but the change varies between different types of LMP intervention.
Source: Eurostat, LMP (lmp_expsumm) and LFS (lfsa_ugad)
Main statistical findings
In 2010, EU Member States spent a total of EUR 266 thousand million on LMP interventions to support the unemployed, people in work but at risk of involuntary job loss, and others needing help to make the transition into work. In relative terms, that figure represents just under 2.2 % of the combined GDP of Member States.
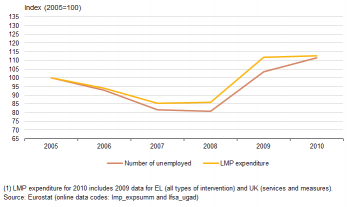
To investigate trends through time, LMP expenditure is considered in real terms (i.e. at constant prices) in order to eliminate the effects of inflation, which vary between countries. Moreover, since LMP expenditure is mostly aimed at helping people who are out of work and wanting to move into employment it is interesting to consider any changes that occur in relation to underlying changes in the number of unemployed. It can indeed be seen in Figure 1 that in the EU as a whole, changes in LMP expenditure tend to follow changes in the underlying level of unemployment, although at a different pace.
The period 2005 to 2008 was largely one of strong economic growth across the European Union, which led to a significant decrease of 19.4 % in the number of unemployed (aged 15-64). Over this period, EU-27 expenditure on LMP declined by 14 % in real terms. In 2009, the main impact of the economic and financial crisis became apparent with an increase of 28.3 % in the number of unemployed in the EU as a whole. In response, EU-27 expenditure on LMP rose by 30 % in the same year. In 2010, however, LMP expenditure stagnated, increasing by just under 0.7 %, whilst the number of unemployed in the EU-27 continued to rise significantly, by 7.7 %.
To provide a better picture of changes in LMP expenditure in relation to changes in the numbers of unemployed, particularly between 2008 and 2010, LMP expenditure can be decomposed into the main types and categories of intervention and the number of unemployed can be broken down by duration of the unemployment spell. This allows changes in expenditure on the main types of LMP intervention to be considered in relation to changes in the numbers of persons unemployed less than 12 months (for convenience the term “short-term unemployed” is used) and persons unemployed for 12 months or more (“long-term unemployed”).
Source: Eurostat, LFS (lfsa_ugad)
Evolution of short-term and long-term unemployment
Duration of unemployment is an important factor in determining who is eligible to benefit from assistance provided through LMP interventions. LMP measures, which aim to improve employability or help people directly into work, are often open only to people who have been unemployed for a minimum period. This is a means of ensuring that money is spent on the people who most need assistance and of avoiding deadweight losses which may occur when interventions are offered too early to people who would (probably) have found a job without any additional assistance. On the other hand, unemployment benefits are often paid only for a limited period so that many people who are long-term unemployed may have exhausted their entitlement to these benefits and depend instead on some form of means-tested social benefit that is not counted within LMP expenditure. Taking these two issues together implies that the structure of unemployment by duration influences the number of people who are potentially eligible for different types of LMP intervention at any time and, therefore, the expenditure on those interventions.
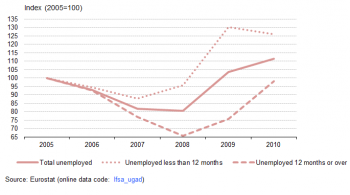
Data on the total number of unemployed between 2005 and 2010 conceal important differences in the numbers who were short- or long-term unemployed (Figure 2). Between 2005 and 2007 the numbers of both short-term and long-term unemployed declined, with the latter falling almost twice as fast as the former (-23.1 % compared to -12.1 %). Whilst the numbers of long-term unemployed continued to decline into 2008 (-14.7 %), the number of short-term unemployed rose 8.7 % as the onset of the crisis led to the substantial job-losses in some Member States. This rise gathered pace in 2009, with the numbers of short-term unemployed increasing 36.2 % as the impact of the crisis was felt across Europe. This was accompanied by a smaller, but still significant, rise of 15.3 % in the numbers of long-term unemployed as those already out of work faced increasing difficulties to find a job. In 2010, the sharp rise in the number in short-term unemployed came to an end and instead there was a small decline of 3.1 % compared to the previous year. However, the number of people unemployed for a year or more rose by 29.7 % as difficult economic conditions persisted and labour demand remained low.
Source: Eurostat, LMP (lmp_expsumm)
Main types of LMP intervention
LMP expenditure can be decomposed into three main types of intervention: services, measures and supports. LMP services cover the costs of all publicly funded services for jobseekers (guidance, counselling and other forms of job-search assistance) as well as any other expenditure of the public employment services (PES) not already covered in other LMP categories. LMP measures (active interventions) cover interventions that aim either to provide people with new skills or experience of work in order to improve their employability or to encourage employers to create new jobs and take on people who are unemployed or otherwise disadvantaged. LMP supports (passive interventions) mostly cover financial assistance designed to compensate individuals for loss of wage or salary and to support them during active job-search (i.e. mostly unemployment benefits). The vast majority (63.2 %) of expenditure on LMP interventions in 2010 across the EU financed LMP supports, while just over a quarter (25.6 %) was devoted to LMP measures and the remaining one ninth (11.3 %) was spent on LMP services.
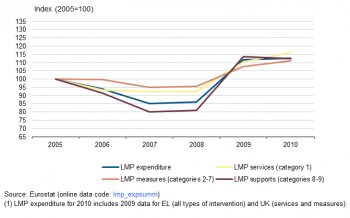
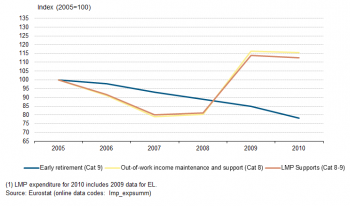
The changes in total LMP expenditure between 2005 and 2010 were not evenly spread between these three main types of intervention (Figure 3). From 2005 to 2008, LMP expenditure declined by 14 % overall but the fall was particularly pronounced for LMP supports, which went down 19 %, whilst those for LMP services and LMP measures were much less severe (7.6 % and 4.3 % respectively). Similarly, as total LMP expenditure rose 30 % between 2008 and 2009, the largest increase related to LMP supports, which went up by 40.5 %, whilst expenditure on LMP services and LMP measures increased by 19.7 % and 12.4 % respectively. In 2010, total LMP expenditure rose by less than a percentage point as expenditure on LMP supports fell by 1.1 % whilst expenditure on LMP services and LMP measures continued to increase, albeit at a slower rate than before (5.1 % and 3.4 % respectively).
Source: Eurostat, LMP (lmp_expsumm) and LFS (lfsa_ugad)
LMP measures and the structure of unemployment
Comparing trends in expenditure on LMP measures with the numbers of unemployed by duration (short-term and long-term) between 2005 and 2010 offers a useful insight into the factors driving changes in expenditure on this type of intervention.
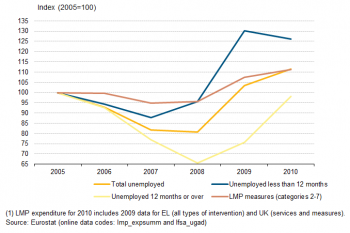
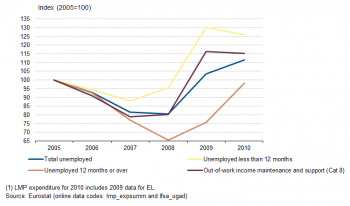
Changes in expenditure on LMP measures share little similarity with changes in the number of short-term unemployed (Figure 4). This is unsurprising given that the best outcome for both the unemployed and the PES is for an individual who becomes unemployed to find work rapidly without assistance and that many active measures are only open to those who have been unemployed for a minimum duration so that there is a built-in lag for flows into LMP measures compared to flows into unemployment.
On this basis it would be reasonable to expect that changes in expenditure on LMP measures would share more similarity with changes in the number of long-term unemployed. However, this is not particularly apparent in the changes observed between 2005 and 2008 as expenditure on LMP measures fell by only 4.3 % whilst the number of long-term unemployed declined by over a third (34.4 %). The lower than expected decline in expenditure might be explained by the possibility that countries were responding to calls from EU-level policy makers to increase spending on active measures or simply that during a period of economic growth and falling unemployment they could afford to maintain spending on active measures and perhaps broaden the scope of assistance to cover more people not yet long-term unemployed, particularly when there were relatively few long-term unemployed. Further, it has to be recognised that the criteria governing access to measures vary from country to country, and even between measures within a country, so that a simple split of short- and long-term unemployed on the basis of less than or more than one year duration (or any other fixed duration, e.g. six months) will never correlate perfectly with the population eligible to participate in LMP interventions. To some extent the idea that spending in the 2005-2008 period covered more short-term (or perhaps “medium-term”) unemployed than before is supported by the fact that expenditure on LMP measures shows more resemblance to the trend in the total number of unemployed during this period.
A link between changes in expenditure on LMP measures and the number of long-term unemployed is more evident in the period from 2008 to 2010 in that both increased throughout the period, however the rates of change are not the same. Both rose significantly from 2008 to 2009 (12.4 % and 15.3 % respectively) with the slightly lower rate of increase in expenditure on LMP measures possibly a reflection, at least in part, of the lead-time needed to approve and implement additional support measures and/or extend existing ones in times of increasing unemployment, since in many cases budgets for active measures do not automatically adjust to demand. However, between 2009 and 2010 there was a more significant divergence in the rates of change as the number of long-term unemployed went up by 29.7 % whilst expenditure on LMP measures rose by just 3.4 %. It is possible that part of this difference relates to the emergence of budget constraints imposed as a result of the sovereign debt crisis, which limited the funds available for LMP measures in some countries.
Source: Eurostat, LMP (lmp_expsumm)
Source: Eurostat, LMP (lmp_expsumm) and LFS (lfsa_ugad)
LMP supports and the structure of unemployment
LMP supports include the various forms of unemployment benefit (which account for the vast majority of LMP category 8 - out-of-work income maintenance and support) and early retirement benefits (category 9). However, the latter represent only 7.5 % of total expenditure on LMP supports (average 2005-2010) so that the trend for LMP supports as a whole is driven strongly by the unemployment benefits in category 8 (Figure 5). Furthermore, expenditure on early retirement benefits shows a quite different trend to the overall trend for LMP supports with a steady decline between 2005 and 2010 resulting a reduction of more than a fifth (22 %) in the amount spent on this category over the period. This is not unexpected since European employment policy is strongly focused on extending working lives and encouraging older workers to remain active in the labour market rather than facilitating their premature withdrawal. Early retirement benefits are therefore out of line with policy objectives and are generally being used less.
Unemployment benefits are granted more or less automatically as soon as people lose their jobs and register with the relevant authority (subject to them satisfying relevant eligibility criteria). In most countries, insured unemployment benefits are time-limited and after that period has expired people have to transfer to unemployment assistance or some other form of social benefit, both of which are usually means-tested. It means that many long-term unemployed do not receive unemployment benefits per se. The result is that when unemployment rises quickly the proportion of unemployed who have recently lost their jobs and are eligible to receive unemployment benefits tends to increase whilst the proportion who are longer-term unemployed and who may have exhausted their entitlement to time-limited unemployment benefits tends to fall. For this reason trends in expenditure on LMP category 8 tend to follow trends in the number of short-term unemployed more closely than those of the long-term unemployed or even total unemployed (Figure 6).
It is important to bear in mind that the duration for which unemployment benefits are payable varies from country to country, and even for individuals within countries (depending, for example, on the history of contributions or on age). It means that, as for LMP measures, it is not possible to say that all short-term unemployed are eligible or that all long-term unemployed are not. For example, in Slovakia unemployment benefits are payable for only six months so that some people treated here as short-term unemployed would not be eligible for benefits and none of the long-term unemployed would be covered. In France, however, the main unemployment benefit (the back-to-work support allowance) is payable for 24 months (and 36 months for those aged 50 or over) so that all (eligible) short-term unemployed are covered as well as a significant proportion of the long-term unemployed.
Between 2007 and 2008 expenditure on LMP category 8 increased only slightly (1.7 %) whilst the number of people short-term unemployed rose much more (8.7 %). It is likely that the increased cost of supporting the short-term unemployed (which is more or less automatic) was offset by the continued decline in the support provided to some long-term unemployed in countries where benefits are provided for more than 12 months. However, other factors may also play a role. For example, in Sweden expenditure on LMP category 8 fell 22.3 % between 2007 and 2008 whilst the number of long-term unemployed fell by 7.5 % and the number of short-term unemployed rose by 2.7 %, neither of which would explain the large fall in expenditure. Rather, the decline in expenditure can be attributed to significant changes in eligibility criteria and the rates of compensation introduced at the start of 2007 with the purpose of reducing expenditure on unemployment insurance benefits.
Partial unemployment benefits and redundancy compensation
Although LMP category 8 primarily covers the provision of unemployment benefits for people who are out of work and actively seeking a job, it is important to be aware that it also includes so-called “partial unemployment benefits", which are paid to compensate employees for loss of earnings when they are placed on short-time working or temporary lay-off due to difficult circumstances for the employer. These people still have an effective contract of employment and are therefore not usually counted as unemployed. The category also includes redundancy and bankruptcy payments, both of which are one-off payments to compensate for loss of a job or for wages not paid by an employer and are not linked to the current employment status of the individual, who may or may not have found an alternative job.
Historically, unemployment benefits have accounted for around 95 % of expenditure in category 8 but during the crisis period this changed. In particular, as the crisis hit during the latter half of 2008 and into 2009 several countries, most notably Germany, made extensive use of short-time working schemes in order to maintain jobs and avoid large-scale job-losses. As a result, expenditure on partial unemployment benefits increased nearly five-fold (388.6 %) between 2008 and 2009 (Table 1). Expenditure on redundancy and bankruptcy compensation also doubled (98.4 %). As a result, the share of unemployment benefits within total expenditure on category 8 supports fell from 96 % to 90 % and the amount spent on these benefits rose by 35.2 % compared to the 44.7 % seen for the category as a whole. Indeed, just over 20 % of the additional expenditure on LMP supports between 2008 and 2009 derives from increased spending on short-time working schemes, which benefit people still in employment, as governments tried to minimise impact of the crisis on jobs. Further, it can be seen that the 1.1 % decline in total expenditure on LMP supports between 2009 and 2010, and category 8 in particular (-0.7 %), stems primarily from a 10.3 % reduction in the expenditure on partial unemployment benefits and, to a lesser extent, an 16.8 % decline in redundancy/bankruptcy payments and not from regular unemployment benefits, which rose by 0.6 %.
Source: Eurostat, LMP (lmp_expsumm) and LFS (lfsa_ugad)
Source: Eurostat, LMP (lmp_expsumm) and LFS (lfsa_ugad)
Source: Eurostat, LMP (lmp_expsumm) and LFS (lfsa_ugad)
Source: Eurostat, LMP (lmp_expsumm) and LFS (lfsa_ugad)
Source: Eurostat, LMP (lmp_expsumm) and LFS (lfsa_ugad)
Source: Eurostat, LMP (lmp_expsumm) and LFS (lfsa_ugad)
Developments in EU Member States
Observations at EU level are not necessarily representative of the situation in individual Member States. In fact there is considerable heterogeneity between countries in terms of both spending on labour market policies and the level of unemployment.
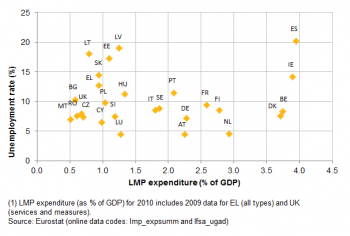
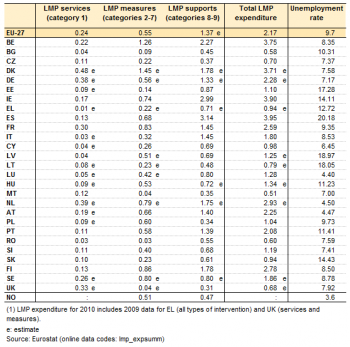
A first illustration of this is the extent to which expenditure on LMP as a proportion of GDP varies between countries. The highest relative level of expenditure in 2010 was reported in Ireland and Spain (both 3.9 % of GDP), followed by Belgium and Denmark – the only other EU Member States to spend more than 3 % of their GDP on such interventions. At the other end of the scale, nine Member States spent less than 1 % of GDP on LMP: Slovakia, Greece (2009 data), Cyprus, Lithuania, the Czech Republic, the United Kingdom (2009 data), Romania, Bulgaria and Malta (see Table 2).
Moreover, these differences have little relation to differences in the level of unemployment as both high and low levels of spending are observed among countries with either high or low unemployment rates (Figure 7 and Table 2). In Spain and Ireland, for example, high levels of spending on LMP (more than 3.5 % of GDP in both cases) are associated with relatively high unemployment (14.1 % in Ireland and 20.2 % in Spain). In contrast, Estonia, Latvia, Lithuania and Slovakia all had similarly high unemployment rates (all between 14 and 19 %) but their expenditure on LMP was only between 0.8 and 1.2 % of GDP.
The reasons for the lack of any clear link between the level of spending on LMP and the underlying level of unemployment are complex and relate to historical institutional and economic factors as well as current government policy. In general, it can be said that relative spending on LMP is significantly lower amongst the countries which joined the EU in 2004 and 2007 than in the EU-15 countries (average of 0.9 % and 2.5 % of GDP respectively). This reflects, at least in part, a combination of the relative wealth of each country, the relative generosity of unemployment benefits (in terms of both value and the period for which they are payable), and (where relevant) the extent to which public intervention in the labour market has developed since the transition from centrally planned to free market economies.
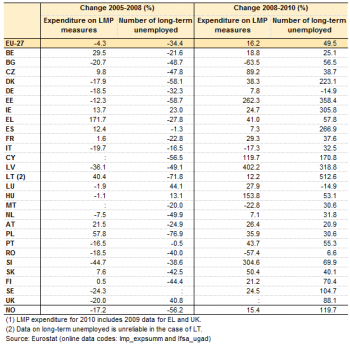
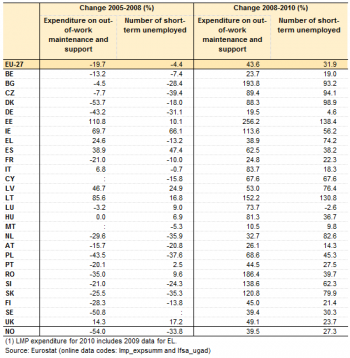
The crisis did not have the same impact in all Member States. Changes in the numbers of unemployed by duration and in the different components of LMP expenditure varied between countries. Comparing the changes that occurred from 2005 to 2008 and then from 2008 to 2010 between countries provides further insight into the relationship between LMP expenditure and the numbers of unemployed (see details in Tables 3 and 4).
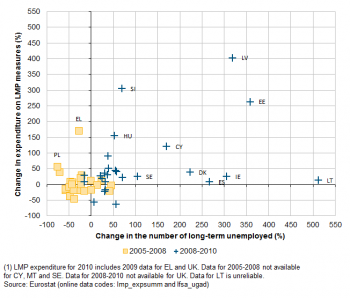
The changes in expenditure on LMP measures and in the numbers of long-term unemployed over these two periods do not offer any clear indication of a common pattern across countries (Figure 8). This is particularly true during the latter period when, despite the fact that the majority of Member States experienced a surge in the number of long-term unemployed as well as an increase in expenditure on LMP measures, the ratio between these two changes varied greatly. For example, ten countries experienced rises in excess of 100 % in either their expenditure on LMP measures or the number of long-term unemployed but these did not necessarily coincide. In Latvia and Estonia, both of which were particularly hard hit by the crisis, massive increases in the numbers of long-term unemployed were accompanied by increases of a similar scale in expenditure on LMP measures. Similar changes but of lesser magnitude are also observed in the case of Cyprus. However, in Lithuania, Ireland, Spain, Denmark, and to a lesser extent Sweden, dramatic rises in long-term unemployment were not matched by equivalent increases in expenditure. From this group, Denmark and Sweden have systems that ensure access to an active measure within a number of months (the precise number may vary with age) and ensure that people are generally placed on an LMP measure well before they become long-term unemployed (according to the 1 year threshold), hence expenditure on measures is more likely to relate to numbers of short- than long-term unemployed. On the other hand, in Slovenia and Hungary, there were significant increases in LMP expenditure but much smaller increases in long-term unemployment. In Hungary, as part of a crisis response programme aimed at reducing the welfare budget, there was a massive investment in 2009 and 2010 in public works type measures designed to test the willingness to work of long-term unemployed people. As participation in these measures breaks the unemployment spell the increased spending meant that the numbers of long-term unemployed were significantly lower than they would have been otherwise. Slovenia also invested more in public works in this period than before the crisis but in addition spent significant amounts on special new measures to retrain workers placed on short-time working because of the economic difficulties being experienced by their employers, i.e. people who are not counted as unemployed at all, let alone long-term unemployed. The different approaches adopted in just these few countries demonstrate why it is difficult to make a clear link between spending on LMP measures and the numbers of long-term unemployed.
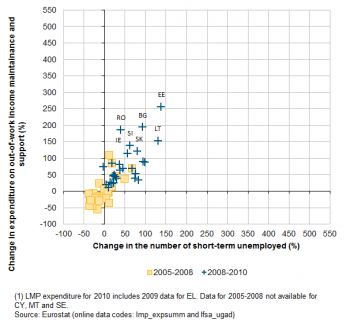
In contrast, comparing changes in LMP expenditure on out-of-work income maintenance and support (LMP category 8) and numbers of short-term unemployed at the Member State level from 2005 to 2008 and then from 2008 to 2010 provides clearer evidence of a common pattern (Figure 9). The same pattern applies in both periods with the main difference between the two being in the scale of change. In the 2008-2010 period a number of countries, particularly amongst those from the Baltic and the East of the Union, experienced a dramatic surge in short-term unemployment and in expenditure on out-of-work income maintenance and support. In Estonia, the most extreme case, the number of short-term unemployed increased by 138.4 % between 2008 and 2010 while expenditure on out-of-work income maintenance and support rose by 256.2 %. In some cases, expenditure increased more than the numbers of unemployed as countries increased the amount of benefit or the time for which it was payable in order to counteract the financial difficulties being experienced by the thousands of families affected by a critical loss of income from wages. Overall, however, the similarities observed between countries support the notion that spending on LMP supports adjusts more or less automatically to changes in level of short-term unemployment.
Data sources and availability
Data source
All data presented in this article were extracted from the Eurostat LMP database. These data are collected annually from administrative sources in each country.
Scope of LMP statistics
LMP statistics cover all labour market interventions which can be described as ’public interventions in the labour market aimed at reaching its efficient functioning and correcting disequilibria and which can be distinguished from other general employment policy interventions in that they act selectively to favour particular groups in the labour market’. The scope of LMP statistics is limited to public interventions that explicitly target groups with difficulties in the labour market; this includes: the unemployed; those employed but at risk of involuntary job loss; and people who are currently inactive in the labour market but would like to work.
Types of interventions
LMP interventions are classified into three main types:
- LMP services refer to labour market interventions where the main activity of participants is job-search related and where participation does not usually result in a change in labour market status.
- LMP measures refer to labour market interventions where the main activity of participants is not job-search related and where participation usually results in a change of labour market status. In other words, a person who is unemployed typically ceases to be considered as such when participating in an LMP measure because they are temporarily in training or work and therefore not both actively seeking and immediately available for work. An activity that does not result in a change of labour market status may still be considered as a measure if the intervention fulfils the following criteria:
- the activities undertaken are not job-search related, are supervised and constitute a full-time or significant part-time activity of participants during a significant period of time, and;
- the aim is to improve the vocational qualifications of participants, or;
- the intervention provides incentives to take-up or to provide employment (including self-employment).
- LMP supports refer to interventions that provide financial assistance, directly or indirectly, to individuals for labour market reasons, or which compensate individuals for disadvantage caused by labour market circumstances.
Additional category breakdowns
The three main types of intervention are further broken down into nine detailed categories according to the type of action:
- LMP services
- 1. Labour market services;
- LMP measures
- 2. Training;
- 3. Job rotation and job sharing;
- 4. Employment incentives;
- 5. Supported employment and rehabilitation;
- 6. Direct job creation;
- 7. Start-up incentives;
- LMP supports
- 8. Out-of-work income maintenance and support;
- 9. Early retirement.
Context
Labour market policy (LMP) interventions cover the range of financial and practical supports offered by governments to people who are unemployed or otherwise disadvantaged in the labour market. The relative levels of spending on LMP in each country are not directly linked to the level of unemployment but depend also on a range of historic institutional and economic factors. However, changes through time are influenced by rises or falls in the numbers of unemployed. Across the European Union, the recent economic and financial crisis has resulted in a significant increase in the number of people who are unemployed and therefore eligible for assistance from LMP interventions. Expenditure on LMP has risen as a result but the changes vary between the different types of LMP intervention. Changes in expenditure on LMP supports can generally be linked to the number of short-term unemployed (less than 12 months), though during the main crisis period additional support for people still employed but on short-time working also had a significant impact. Changes in expenditure on LMP measures are expected to relate more closely to long-term unemployment (12 months or over) but a range of other factors can significantly influence the amounts spent so that it is difficult to make a clear correlation.
The European Employment Strategy provides a framework for EU countries to share information, discuss and coordinate their employment policies. In this framework the Employment Guidelines provide common priorities and targets for employment policies.
LMP statistics are one of the data sources for monitoring the Employment Guidelines through the Joint Assessment Framework (JAF). The JAF is an indicator-based assessment system developed and used by the European Commission and the Employment Committee. Organised into 12 policy areas, the JAF includes a series of indicators used to monitor the progress towards EU headline targets and associated national targets in relation to the implementation of the Employment Guidelines. Indicators related to LMP fall within policy area 3: Active labour market policies and policy area 4: Adequate and employment oriented social security systems.
Further Eurostat information
Publications
- Labour market policy – expenditure and participants - Data 2010
- Labour market policy expenditure fell by more than 14% in real terms between 2005 and 2008 - Statistics in focus 66/2010
Main tables
- Labour market policy
- Main tables
- Labour market policy (t_lmp)
- Public expenditure on labour market policies, by type of action (tps00076)
- Public expenditure on labour market policy measures, by type of action (tps00077)
- Public expenditure on labour market policy supports, by type of action (tps00078)
- Participants in labour market policy measures, by type of action (tps00079)
- Beneficiaries of labour market policy supports, by type of action (tps00080)
- Persons registered with Public Employment Services (tps00081)
- Labour market policy (t_lmp)
- Main tables
Database
- Labour market policy
- Database
- Labour market policy (lmp)
- Public expenditure on labour market policy (LMP) interventions (lmp_expend)
- Participants in labour market policy (LMP) interventions (lmp_particip)
- LMP based indicators for monitoring the Employment Guidelines (lmp_indic)
- Persons registered with Public Employment Services (PES) (lmp_rjru)
- Labour market policy (lmp)
- Database
Methodology / Metadata
- Labour market policy (ESMS metadata file - lmp_esms)
- Labour market policy database – Methodology – Revision of June 2006
- Addendum to the 2006 LMP methodology, March 2009, see Dedicated section: Labour market policy
