Archive:Agricultural census in Ireland
- Data from November 2012. Most recent data: Further Eurostat information, Main tables and Database.
This article is part of a series of country-specific essays on the results of the European Union (EU) Farm structure survey (FSS) 2010. The FSS collects information on the structural characteristics of the agricultural holdings (land use, livestock and labour force) and is carried out every 10 years as an Agricultural census by all the EU Member States, with two or three additional, intermediate sample surveys carried out in-between. The present analysis of the Austrian farm structure includes a comparison with the previous (2000) Agricultural census. Although the reference years of the Agricultural census in Austria were 1999 and 2010 respectively, the common designation is Agricultural census 2000 and 2010.

Table 1: Farm structure, key indicators, Austria, 2000 and 2010
Source: Eurostat (ef_kvaareg) (ef_ov_kvaa) (demo_pjan) and FSS 2000 and 2010
Source: Eurostat (ef_kvaareg) (ef_ov_kvaa) (demo_pjan) and FSS 2000 and 2010

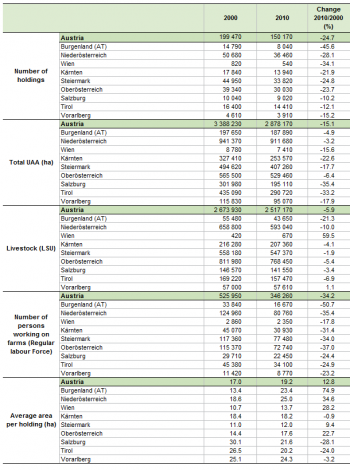
Table 2: Farm structure, key indicators, by NUTS 2 regions, Austria, 2000 and 2010
Source: Eurostat (ef_kvaareg) (ef_ov_kvaa) and FSS 2000 and 2010
Source: Eurostat (ef_kvaareg) (ef_ov_kvaa) and FSS 2000 and 2010

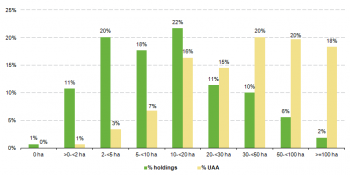
Figure 1: Number of holdings and utilised agriculture area (UAA) by UAA size classes, Austria, 2010 (%)
Source: Eurostat (ef_kvaareg) (ef_ov_kvaa)
Source: Eurostat (ef_kvaareg) (ef_ov_kvaa)

