Archive:European Neighbourhood Policy - East - agriculture statistics
- Data from MM/YYYY Most recent data: Further Eurostat information, Main tables and Database.
This article provides a brief description of agriculture in the European Neighbourhood Policy - East (ENP-E) countries. It focuses on many aspects of agriculture in ENP countries, such as its contribution to the economy (the gross value added of the agricultural sector), the Utilised Agriculture Area (UUA), the cereal production, the livestock population, dairy cows and slaughtered production in Armenia (AM), Azerbaijan (AZ), Belarus (BY), Georgia (GE), Moldova (MD) and Ukraine (UA).

Source: for the EU-27, Eurostat (online data code: (nama_nace06_c); for the ENP-East countries, Eurostat (online data code: (enpr_ecnabrk))

Source: for the EU-27, Eurostat (online data codes: (lfsa_egana) and (lfsa_egan2); for the ENP-East countries, Eurostat (online data code: (enpr_ecnabrk))
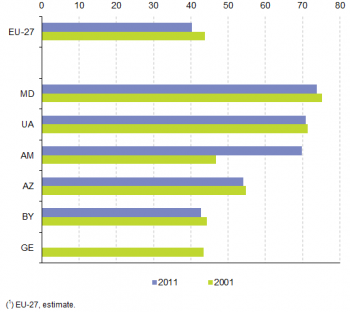
Source: for the EU-27, Eurostat (online data code: (apro_cpp_luse); for the ENP-East countries, Eurostat (online data code: (enpr_agmain))
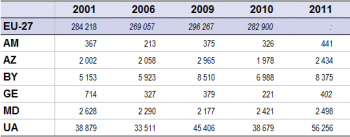
Source: for the EU-27, Eurostat (online data code: (apro_cpp_crop); for the ENP-East countries, Eurostat (online data code: (enpr_agmain))

Source: for the EU-27, Eurostat (online data code: (food_in_pagr1); for the ENP-East countries, Eurostat (online data code: (enpr_agmain))
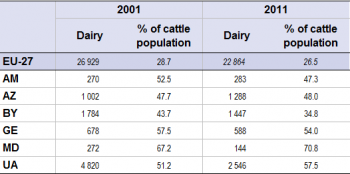
Source: for the EU-27, Eurostat (online data code: (food_in_pagr1); for the ENP-East countries, Eurostat (online data code: (enpr_agmain))
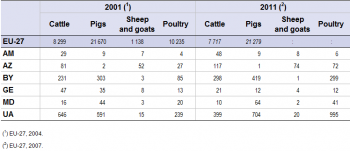
Source: for the EU-27, Eurostat (online data code: (food_in_pagr2); for the ENP-East countries, Eurostat (online data code: (enpr_agmain))

Source: for the EU-27, Eurostat (online data code: (ds_018995); for the ENP-East countries, Eurostat (online data code: (enpr_ecsitc))
Source: for the EU-27, Eurostat (online data code: (ds_018995); for the ENP-East countries, Eurostat (online data code: (enpr_ecsitc))
Main statistical findings
During the last decade, the gross value added (GVA) and employment in the agricultural sector declined in nearly all ENP-East countries.
The agricultural sectors of each of the ENP-East countries remain significant; agricultural activities continue to generate a large — if shrinking — share of the growing output of the regions’ economies and to provide employment for millions. The output of the agricultural sector — measured in terms of gross value added — contributed significantly more to the national economies of the ENP-East countries than was the case for the EU-27 (1.7 % in 2011): the share ranged from 5.7 % in Azerbaijan (estimation) to 22.1 % in Armenia – (see Table 1).
In 2011, employment in agricultural activities represented a little over 10 % of all employment in Belarus — the lowest share among the ENP-East countries – through almost 38 % in Azerbaijan and over 50 % in Georgia. These were significantly higher rates than the EU-27 average (4.6 % in 2011). In 2011, employment in agricultural activities decreased in all ENP-East countries except in Georgia, as compared with 2001 (see Table 2).
Ukraine is a significant cereal producer
A higher proportion of land is dedicated to agricultural activities in the ENP-East countries than in the EU-27 (Figure 1). About 70 % of the total land areas of Moldova, Armenia and Ukraine were used for agricultural activities in 2011 compared to 40 % in the EU-27. This is particularly noteworthy in the case of Ukraine where the 42 million hectares of land used for agricultural activities was the equivalent of just under one quarter (24.1 %) of the total utilised agricultural area of the EU-27 in 2011.
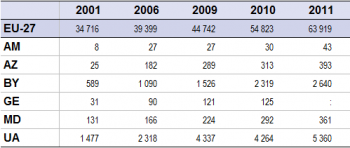
In terms of crop production, Ukraine was by far the biggest agricultural producer in the region (see Table 3). Indeed, for some types of agricultural output, Ukraine produced more than a majority of Member States; only France (64 million tonnes) produced more cereals than Ukraine (56 million tonnes) in 2011.
On the other hand, Georgia and Armenia were the smallest producers of cereals among the ENP-East countries in 2011. Indeed, these countries produced roughly 400 thousand tonnes of cereals (including rice). For Armenia, Azerbaijan, Ukraine and Belarus, cereal production increased by 20.0%, 21.6%, 44.7% and 62.5% respectively between 2001 and 2011. Meanwhile, Georgia and Moldova reported a decrease of 43.7% and 4.9% respectively.
Depending of the country, the structure of the livestock population differs between the ENP-East countries (see Table 4). Cattle were the most numerous livestock population in Armenia, Belarus and Georgia, while in Azerbaijan and Moldova it was sheep and goats that were in the majority. In Ukraine, pigs accounted for the largest part of the livestock population. The distribution of the livestock population between categories remained the same in 2001 and 2011. In Georgia, Moldova and Ukraine, the total number of heads (cattle, pigs, sheep and goats) decreased from 2001 to 2011, while in Azerbaijan only the number of pigs dropped, by 177%, over this period. Also in Belarus the number of sheep and goats fell between 2001 and 2011, by -19%.
The proportion of dairy cows among the cattle population was higher in the ENP-East countries than in EU-27 (see Table 5). Indeed, around one head out of four in the cattle population was a dairy cow in EU-27, while in the ENP-East countries this percentage ranged from 34.8% in Belarus to 70.8% in Moldova in 2011. In most of the countries, the population of dairy cows decreased between 2001 and 2011, from -18.9% in Belarus to -47.2% in Ukraine. The cattle population increased in Belarus, Armenia and Azerbaijan (4.0%, 16.5% and 27.8% respectively) and decreased in the other countries (-7.8% in Georgia, -49.7% in Moldova and -53.0% in Ukraine).
In terms of slaughtered production, the cattle production was larger than any other forms of animal production in Armenia, Azerbaijan and Georgia in 2011, while pig was the highest slaughtered production in Belarus and Moldova (see Table 6).
Strong growth of the trade of food and live animals
Similarly to the EU-27 countries, there was strong growth in the trade of food and live animals in the ENP-East countries over the respective period (2001 to 2011). There was also a strong increase in the values of imports of food and live animals in the ENP-East countries (see Table 7), particularly in Georgia (2001-2010) and Moldova where the value of the imports of food and live animals was multiplied by four. For Azerbaijan, Georgia and Armenia, the growth in net imports resulted in a progressive widening of the trade deficit in food and live animals. In contrast, Moldova turned its trade deficit into a growing surplus, joining Ukraine and Belarus as the ENP-East countries with a positive trade balance in these products in 2011 (see Table 8).
Data sources and availability
The data for the ENP are supplied by and under the responsibility of the national statistical authorities of each of the countries or territories on a voluntary basis. Data from other sources are very limited and clearly identified. The data for Armenia, Azerbaijan, Belarus, Georgia, Moldova and Ukraine are taken from the key indicators that are collected on a regular basis by Eurostat. The data for Algeria, Egypt, Israel, Jordan, Lebanon, Morocco, the occupied Palestinian territory, Syria and Tunisia are collected by Eurostat within the framework of the MEDSTAT project.
The statistics that are included in this article are freely available on-line
Context
Agriculture was one of the first sectors of the economy (following coal and steel) to receive the attention of EU policymakers, and statistics on agriculture were initially designed to monitor the main objectives of the Common Agricultural Policy. The development of statistics on agriculture then followed the evolution of the Common Agricultural Policy and its new objectives through a larger scope of the statistical data collection at EU level and the development of new indicators.
In cooperation with ENP partners, Eurostat has the responsibility ‘to promote and implement the use of European and internationally recognised standards and methodology for the production of statistics, necessary for developing and monitoring of policy achievements in all policy areas’ . Eurostat undertakes the task of coordinating EU efforts to increase the statistical capacity of all ENP countries. The data that are presented in this article are provided thanks to the annual data collection cycles that have been established by Eurostat for the ENP-East countries.
The policy context of the European Neighbourhood Policy (ENP) is explained here.
Further Eurostat information
Publications
- European Neighbourhood Policy Countries - Leaflet - 2012 edition
Database
- Title(s) of second level folder (if any)
- Title(s) of third level folder (if any)
Dedicated section
External links
See also
Notes
[[Category:<Under construction>|Name of the statistical article]]
[[Category<Subtheme category name(s)>|Name of the statistical article]] [[Category:<Statistical article>|Name of the statistical article]]
Delete [[Category:Model|]] below (and this line as well) before saving!