Archive:Enlargement countries - agriculture, forestry and fisheries statistics
This article provides a description of agriculture in the Enlargement countries. It focuses on many aspects of agriculture such as land use, selected agricultural production, livestock population and slaughtered production, as well as employment and the gross value added of the agricultural sector in the Enlargement countries.

Source: for the EU-27, Eurostat (online data codes: (apro_cpp_luse) and (for_area); for the enlargement countries, Eurostat (online data code: (cpc_agmain)

Source: for the EU-27, Eurostat (online data code: (apro_cpp_luse); for the enlargement countries, Eurostat (online data code: (cpc_agmain)

Source: for the EU-27, Eurostat (online data codes: (apro_cpp_crop) and (apro_mk_farm); for the enlargement countries, Eurostat (online data code: (cpc_agmain)

Source: for the EU-27, Eurostat (online data codes: (apro_mt_lscatl), (apro_mt_lspig), (apro_mt_lssheep) and (apro_mt_lsgoat); for the enlargement countries, Eurostat (online data code: (cpc_agmain)

Source: for the EU-27, Eurostat (online data code: (apro_mt_pann); for the enlargement countries, Eurostat (online data code: (cpc_agmain)

Source: for the EU-27, Eurostat (online data codes: (lfsa_egan2) and (lfsa_egana); for the enlargement countries, Eurostat (online data code: (cpc_ecnabrk)

Source: for the EU-27, Eurostat (online data code: (nama_nace10_c); for the enlargement countries, Eurostat (online data code: (cpc_ecnabrk)
Main statistical findings
Utilised agricultural area (UAA): decreasing trend in the EU-27, mixed picture in the enlargement countries
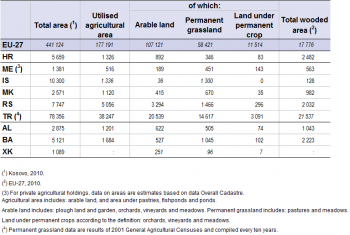
The utilised agricultural area (UAA) as a proportion of the total territorial area decreased in the EU-27 between 2001 and 2011 (from 44 % to 40 %). In the enlargement countries, the tendencies varied: whereas the UAA remained stable in Serbia, Bosnia and Herzegovina, Montenegro and Iceland, it decreased in Turkey and the former Yugoslav Republic of Macedonia (see Figure 1). In contrast, an increase was registered in Albania and Croatia. The highest proportion by a considerable margin, both in 2001 and in 2011, was registered in Serbia, with 65 % of the total land area. The UAA of the EU-27 amounted to around 177 million hectares in 2011, around three and a half times the size of the combined total for the enlargement countries (see Table 1).
Arable land or permanent grassland accounts for the majority of UAA in the enlargement countries
Across the EU-27 as a whole, arable land accounted for 60 % of the UAA in 2011 (see Table 1). This high share was exceeded by Croatia (67 %) and Serbia (65 %). Permanent grassland, on the other hand, accounted for 97 % in Iceland, which can be explained by the particular climatic conditions of that country; this proportion exceeded by far those of the other enlargement countries where it ranged between 26 % and 62 %. In Iceland, comparatively low temperatures, which may fluctuate by 10–20°C within a day, considerably limit the growing potential for a range of crops and their yield. Icelandic agriculture is therefore largely animal based. Land under permanent crop constituted by far the smallest share of the UAA, both in the EU-27 and in the various enlargement countries (shares of well under 10 %).
In 2011, the production of cereals in the EU-27 amounted to nearly six times the production of cereals in the enlargement countries, while the UAA of the EU-27 was around three and a half times the size of the combined total for the enlargement countries
The production of cereals across the EU-27 increased only marginally between 2001 and 2011 (see Table 2). Among the enlargement countries, Croatia, Serbia, Bosnia and Herzegovina as well as Kosovo [1] also reported only minor changes. The other countries experienced a clear increase; especially noticeable was that of Albania, where cereal production grew by nearly 40 % reaching 701 thousand tonnes in 2011. The far higher relative increases registered for Montenegro and Iceland should be seen in the light of very low production volumes in 2001. Other than that, sugar beet production showed more diverse trends: whereas the production of this vegetable in the EU-27 declined (–8.1 % comparing 2001 and 2011), that of Croatia, Turkey and (particularly) Serbia increased. Worth noting is the fact that in the former Yugoslav Republic of Macedonia sugar beet production fell to zero by 2011, whereas in 2001 there were still 38 thousand tonnes harvested. Furthermore, milk production (which may include milk production other than cows’ milk) increased in all the enlargement countries for which data are available, except in Serbia, where the total production volume in 2011 was 9 % lower compared with 2001. In the EU-27, cows’ milk production in 2011 remained at a similar level as in 2001.
Climatic and cultural peculiarities of the enlargement countries are reflected in their livestock production and slaughtering
Cultural peculiarities are reflected in livestock production (see Table 3). In Turkey for instance, pig production is extremely limited. Iceland, with a mere number of 318 thousand inhabitants, counted more pigs than Turkey (where the population is close to 74 million). Conversely, the number of sheep and goats in Iceland was impressive (in relation to that country’s population), as these animals are highly adaptable to the harsh Icelandic environment. Pig herds of just over 1.2 million and 3.3 million heads were recorded in Croatia and Serbia; however, while the number of pigs in Croatia remained stable when comparing 2001 and 2011, the number of pigs in Serbia was 8 % lower compared with 2001. The number of sheep and goats in Turkey decreased compared with 2001 but still amounted to over 32 thousand heads in 2011, which corresponded to a third of the total population registered in the EU-27. In the former Yugoslav Republic of Macedonia, the decrease was far more important in relative terms (–35 % compared with the year 2001). Finally, the number of cattle experienced a noticeable decline in Albania, Serbia and, above all, in Montenegro, whereas Turkey was the only enlargement country where the number of cattle significantly increased (+17 %).
Looking at animal slaughter in 2011, pig meat accounted for nearly 52 % of total meat production in the EU-27, a proportion similar to that recorded for the former Yugoslav Republic of Macedonia (51 %) and exceeded only by Serbia (59 %) – see Figure 2. Poultry was the most important category in Turkey (68 %) and in Bosnia and Herzegovina (50 %). Sheep and goats constituted the highest proportion in animal slaughter in Iceland (36 %).
The agricultural sector remains significant in most enlargement economies
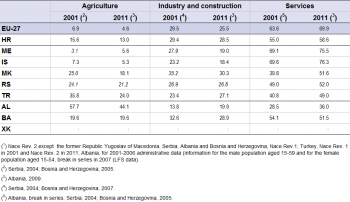
Employment in agriculture was by far the least important among the three sectors in the EU-27 and fell to below 5 % of the total labour force by 2011 (see Table 4). Iceland and Montenegro also recorded low shares that year. In contrast, over 44 % of Albania’s labour force was employed in agriculture in 2009, although this indicated a reduction when compared with 2001 (when the country registered a share of almost 58 %). In Turkey, nearly a quarter of the labour force was employed in agriculture, while in Serbia this share was slightly higher than one fifth of the labour force.
In contrast to the EU-27, the economies of the enlargement countries generated a considerably higher proportion of Gross Value Added (GVA) from the agriculture, forestry and fishing sectors (see Figure 3). In 2011, the EU-27 recorded a value of only 1.7 %, while for the enlargement countries values ranged from just over 5 % of total GVA in Croatia to 19.3 % in Albania (according to the latest available data). Still, the agriculture sector’s share in total GVA had declined by widely varying amounts in all the enlargement countries, most notably in Serbia (by around 10 percentage points between 2000 and 2010, reaching a proportion of 10.4 %) and Albania (close to 6 percentage points during the same period, reaching a share of 19.3 %).
Data sources and availability
Data for a core set of indicators are collected each year through questionnaires sent out by Eurostat to the partner countries. A network of contacts in each country has been established for updating the questionnaires. Eurostat distributes the electronic questionnaires to a single contact point in each partner country. This contact point is in charge of the onward distribution of the questionnaires to the various thematic co-ordinators in each country's statistical system (generally within the national Statistical Offices) and of their collection afterwards. When completed, the validated and updated questionnaires are sent back to Eurostat.
The overall framework of enlargement policy and international statistical cooperation is explained here.
The statistics that are included in this article are freely available on-line and form part of the publication “Key Figures on the enlargement countries” – 2013.
Context
Agriculture was one of the first sectors of the economy (following coal and steel) to receive the attention of EU policymakers, and statistics on agriculture were initially designed to monitor the main objectives of the Common Agricultural Policy. Developments of statistics on agriculture have then followed the evolution of the Common Agricultural Policy and its new objectives through a larger scope of the statistical data collection at EU level and the development of new indicators.
Agriculture is a complex, sensitive and critical issue in enlargement preparations and the candidate countries have to align their agricultural policy with the common agricultural policy (CAP) to be fully integrated from the day of accession.
Further Eurostat information
Publications
- Key figures on the enlargement countries – 2013 edition
Leaflets
Enlargement countries - Agriculture - 2012 edition
Database
- Title(s) of second level folder (if any)
- Title(s) of third level folder (if any)
Dedicated section
External links
See also
Notes
- ↑ This designation is without prejudice to positions on status, and is in line with UNSCR 1244 and the ICJ Opinion on the Kosovo Declaration of Independence.
[[Category:<Under construction>|Name of the statistical article]]
[[Category<Subtheme category name(s)>|Name of the statistical article]] [[Category:<Statistical article>|Name of the statistical article]]
Delete [[Category:Model|]] below (and this line as well) before saving!