.PNG)
.PNG&body=Statistics Explained - Indices of the agricultural production of crops, EU-27(2000=100).PNG %0A https%3A%2F%2Fec.europa.eu%2Feurostat%2Fstatistics-explained%2Findex.php%3Ftitle%3DFile%3AIndices_of_the_agricultural_production_of_crops%2C_EU-27%282000%253D100%29.PNG)
File:Indices of the agricultural production of crops, EU-27(2000=100).PNG
Revision as of 16:01, 14 October 2009 by Verdodo (talk | contribs) (→Most recent data available now, see:)
.PNG&diff=prev&oldid=13272)
.PNG&direction=prev&oldid=13272)
No higher resolution available.
Indices_of_the_agricultural_production_of_crops,_EU-27(2000=100).PNG (670 × 296 pixels, file size: 18 KB, MIME type: image/png)
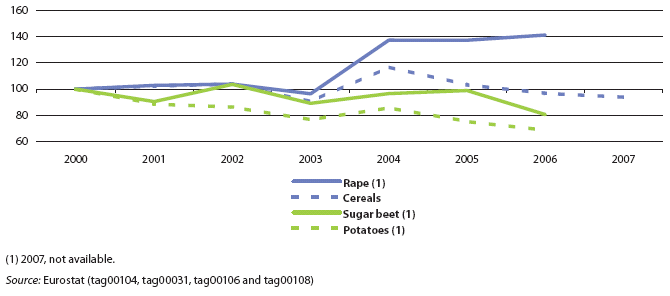
Indices of the agricultural production of crops, EU-27
- (2000=100)
Graph created with data from September 2008
Most recent data available now, see:
Rape, production - 1 000 t (tag00104)
Cereals, production - 1 000 t (tag00031)
File usage
There are no pages that use this file.
.PNG&oldid=13272)
.PNG)
.PNG&action=edit&redlink=1)
.PNG&action=history)