,_EU-27,_2010_(1)_(%25_share_of_sectoral_total).png)
, EU-27, 2010 (1) (% share of sectoral total).png&body=Statistics Explained - Sectoral analysis of manufacture of food products (NACE Division 10), EU-27, 2010 (1) (% share of sectoral total).png %0A https%3A%2F%2Fec.europa.eu%2Feurostat%2Fstatistics-explained%2Findex.php%3Ftitle%3DFile%3ASectoral_analysis_of_manufacture_of_food_products_%28NACE_Division_10%29%2C_EU-27%2C_2010_%281%29_%28%2525_share_of_sectoral_total%29.png)
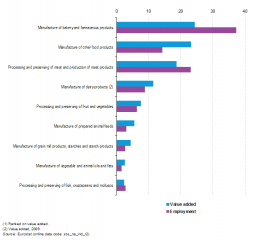
File:Sectoral analysis of manufacture of food products (NACE Division 10), EU-27, 2010 (1) (% share of sectoral total).png
Revision as of 09:24, 7 May 2013 by EXT-S-Allen (talk | contribs)

Size of this preview: 641 × 599 pixels. Other resolutions: 257 × 240 pixels | 706 × 660 pixels.
Original file (706 × 660 pixels, file size: 18 KB, MIME type: image/png)
File usage
The following page uses this file:
,_EU-27,_2010_(1)_(%25_share_of_sectoral_total).png&oldid=130972)
,_EU-27,_2010_(1)_(%25_share_of_sectoral_total).png)
,_EU-27,_2010_(1)_(%25_share_of_sectoral_total).png&action=edit&redlink=1)
,_EU-27,_2010_(1)_(%25_share_of_sectoral_total).png&action=history)