Archive:EU citizenship - statistics on cross-border activities
- Data from April 2013. Most recent data: Further Eurostat information, Main tables and Database.
Citizens of EU Member States (referred to here as EU citizens) enjoy a range of rights and freedoms making it easy to live and work in other Member States, to travel within the EU as tourists, visitors or on business, to study in other parts of the EU, and to readily make cross-border purchases within the EU single market. In many cases, some of these rights apply also to third country nationals (citizens of non-EU countries) who reside legally in the EU.
Using the latest available Eurostat data, this article looks briefly at the different ways in which EU citizens make use of these rights


Main statistical findings
<description and/or analysis of most important statistical data, illustrated by tables and/or figures and/or maps>
Text with Footnote [1]
13.6 million EU citizens live in an EU Member State other than their country of citizenship
In 2012, the population of the EU included 34.3 million foreign citizens, representing 6.8% of the total population (table 1). More than one third (13.6 million) of these people were citizens of another EU Member State. Foreign citizens are defined here as persons who do not hold the citizenship of their country of residence, regardless of whether they were born in the country or elsewhere.
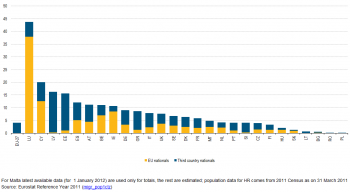
As presented in Figure 1, Luxembourg was the EU Member State with the highest share of foreigners (43.8% of the total population). A high proportion of foreign citizens was also observed in Cyprus (20.1%), Latvia (16.3%) and Estonia (15.7%).
In most Member States, the majority of resident foreigners are third country nationals. At the beginning of 2012, only in Belgium, Ireland, Cyprus, Luxembourg, Hungary, Malta and Slovakia were there more citizens of other EU Member States than third-country nationals.
Due to better data availability, information on citizenship has often been used to study populations with a foreign background. However, since citizenship can change over time, it is also useful to present information by country of birth.
There were 33.0 million people born outside a country of the EU-27 on 1 January 2012 and there were 17.2 million persons who were born in a different EU-27 Member State from the current country of residence. Only in Luxembourg, Ireland, Hungary, Cyprus and Malta did foreign-born persons from other EU-27 countries outnumber those born outside the EU-27. People born abroad outnumbered foreign citizens in all Member States, except Luxembourg, Latvia and the Czech Republic.
In 2011, 782 thousand people acquired citizenship of an EU Member State. Although the great majority of acquisitions were by people who were previously third country nationals, 82 thousands persons who were already citizens of one of the Member States acquired citizenship of another 27 Member State; this amounts to 10,5% of the total of persons acquiring citizenship. As can be seen on figure 2, mainly people with Romanian and Polish citizenships acquired another EU citizenship in 2011.
A majority of foreign workers are citizens of another EU country in ten Member States
In 2012, just over 15 million people employed in the EU were foreign citizens, corresponding to 7.1% of the total population in employment. 6.5 million (43.4% of employed foreigners) were citizens of another EU Member State, while 8.5 million (56.6%) were third country nationals. The share of foreign citizens as a proportion of the employed population varied greatly between Member States (figure 3). Luxembourg had the largest proportion of foreign citizens in employment (50.1% of the employed population), followed by Cyprus (23.2%), and then Ireland, Estonia, and Latvia, ranging from 14.9 % to 14.4 %.
In nine Member States the majority of employed foreigners were citizens of other EU Member States (figure 4). In order of magnitude, these were Luxembourg, Ireland, Belgium, Slovakia, Cyprus, Hungary, UK, Netherlands and Sweden.
A decrease in the number of trips to another EU Member State for personal purposes between 2008 and 2011
Although the statistics above refer to people who are living and working in another Member State, it is also useful to consider the far larger number of EU citizens who make temporary visits to other Member States. One of the basic principles of the EU is that of free movement. EU citizens may travel freely to other Member States, facilitating tourism, visits to friends and family, and business travel. It is important to note that the available statistics relate to visits made by EU residents rather than citizens of the Member States.
As shown in table 2, in 2011, EU residents undertook around 179 million trips of at least one night for holiday, tourism and other personal reasons in a Member State other than the country of residence. Approximately 28 million business visits of at least one night were also made to another Member State.
A number of factors may result in increases or decreases in the number of personal and business visits over time – in particular, economic changes. Comparing annual figures for 2011 with those for 2008 (see figure 5), EU residents made around 4.4 million fewer trips of at least one night for personal purposes to another EU Member State, representing a decrease of -2.4%. 15 of the 23 Member States for which data is available for both years encountered an increase in trips to other Members States, the highest increases being observed in Estonia (+63.7%), Spain (+30.8%) and Finland (+30.4%). In contrast, decrease was reported in 8 Member States, with the biggest decrease in Poland (-32.5%).
UK is the top destination for student from other member States
An increasingly important part of intra-EU mobility is that of students choosing to study in another EU Member State. The number of EU citizens studying in other Member States has grown steadily over the past decade, reaching a total of 571.1 thousand in 2010. The five main countries of citizenship of these students were Germany (15.8% of all EU citizens studying elsewhere in the EU), France (9.0%), Italy (8.1%), Poland (7.7%) and Greece (5.7%).
In 2010, educational institutions in the UK had by far the highest number of students from other Member States with 177 thousand students (31.0% of the total number of EU citizens studying in other Member States), followed by institutions in Germany and Austria with 14.1% and 8.2% respectively. Overall, these three Member States were the place of study for over half of the EU foreign students who were attending an undergraduate or postgraduate university courses (figure 6).
The proportion of students who are citizens of another EU Member State varies greatly – between 0.1% of students studying in Lithuania and Malta, to 42.3% in Luxembourg. It is important to note however that these are not necessarily people who have migrated for study reasons. Some will already be living in the country of study, including the descendants of migrants to that country who have not acquired citizenship.
Internet e-commerce and cross-border purchases by individuals
The use of the internet as a means of shopping means that citizens are less restricted to making purchases from suppliers in their immediate area. Information is readily accessible about good and services that are being marketed by suppliers in other areas and, indeed, in other countries. Prices may be compared and purchases made remotely, without the supplier and the purchaser physically meeting.
In 2012, 45% of individuals (aged 16-74 years) in the EU reported having bought or ordered goods or services over the internet for private purposes, an increase of 13 percentage points compared to 2008. The share of e-shoppers varied between Member States, ranging from 5% in Romania, 9% in Bulgaria and 17% in Italy to 73% in Denmark and the United Kingdom and 74% in Sweden.
As the proportion of individuals purchasing over the internet has grown, there has been an overall increase in the proportion of those who are placing orders with suppliers in other Member States. In 2012, about a quarter of the EU-27 population who made purchases over the internet bought at least once from a seller in another Member State (24%). In 2008, about a fifth of e-shoppers (19%) made EU cross-border purchases (Figure 8).
There are large differences between Member States in terms of the proportion of internet purchases that are made in other Member States. In 2008 and 2012, 88% of persons in Luxembourg who had ordered over the internet had made online purchases from suppliers in other Member States. Malta had the same high proportion with 88% (with an increase of 9 percentage points compared with 2008) and Cyprus recorded 87%, an increase of 19 percentage points compared to 2008. The lowest proportions were recorded in Czech Republic (15%), Germany (14%) and Poland (8%).
It is likely that these patterns are explained by the particular characteristic of size of the Member States concerned. Smaller Member States such as Cyprus, Luxembourg and Malta will have fewer domestic suppliers, giving a stronger incentive for internet purchasers to look to suppliers abroad. In contrast, the size of UK and Germany means that there is a large number of internal suppliers and therefore purchasers have less reason to compare prices and services available with suppliers in other Member States. In certain cases, geographical and cultural proximity, as well as a common language with another larger Member State, may result in relatively high levels of internet purchases from abroad. This is likely to be the case for Ireland (purchases made with suppliers in the UK) and Austria (from suppliers in Germany.
Data sources and availability
<description of data sources, survey and data availability (completeness, recency) and limitations>
Context
<context of data collection and statistical results: policy background, uses of data, …>
Further Eurostat information
Publications
Main tables
- Title(s) of second level folder (if any)
- Title(s) of third level folder (if any)
Database
- Title(s) of second level folder (if any)
- Title(s) of third level folder (if any)
Dedicated section
Methodology / Metadata
<link to ESMS file, methodological publications, survey manuals, etc.>
Student exchange programmes: Students in exchange programmes that fulfil part of their studies at an educational institution abroad but are credited at their home institution should be excluded from the enrolment statistics of the host country and be reported only in the country of original enrolment. Exchange programmes (or short-term postings) are characterised as normally lasting 3 months (or one semester) and in many cases less than a full academic year.
The defining characteristic of such students are that they are given credits for their stay abroad at their home institution where they originally enrolled (they are therefore also called credit students/ credit point students). Students in exchange programmes do not obtain their qualification at the host institution abroad but at their home institution where they originally enrolled. It is recognised that this will result in under-reporting of student mobility as these students are currently outside the scope of the UOE data collection.
- Name of the destination ESMS metadata file (ESMS metadata file - ESMS code, e.g. bop_fats_esms)
- Title of the publication
Source data for tables, figures and maps (MS Excel)
Other information
<Regulations and other legal texts, communications from the Commission, administrative notes, Policy documents, …>
- Regulation 1737/2005 (generating url [http://eur-lex.europa.eu/LexUriServ/LexUriServ.do?uri=CELEX:32005R1737:EN:NOT Regulation 1737/2005]) of DD Month YYYY on ...
- Directive 2003/86/EC (generating url [http://eur-lex.europa.eu/LexUriServ/LexUriServ.do?uri=CELEX:32003L0086:EN:NOT Directive 2003/86/EC]) of DD Month YYYY on ...
- Commission Decision 2003/86/EC (generating url [http://eur-lex.europa.eu/LexUriServ/LexUriServ.do?uri=CELEX:32003D0086:EN:NOT Commission Decision 2003/86/EC]) of DD Month YYYY on ...
<For other documents such as Commission Proposals or Reports, see EUR-Lex search by natural number>
<For linking to database table, otherwise remove: {{{title}}} ({{{code}}})>
External links
See also
Notes
- ↑ Text of the footnote.
[[Category:<Population, Labour market, Education and training etc.?>|EU citizenship - statistics on cross-border activities]] [[Category:<Statistical article>|EU citizenship - statistics on cross-border activities]]