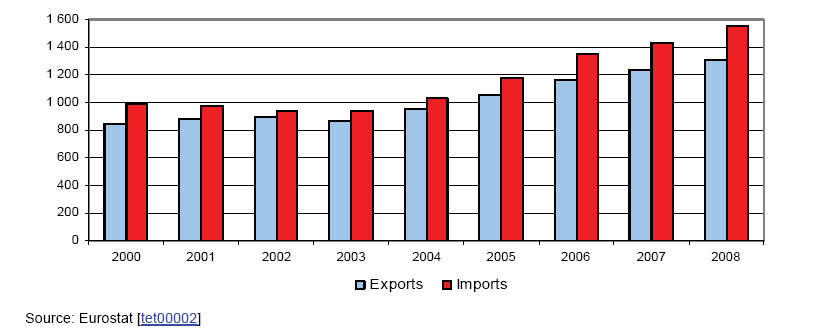
File:Evolution of extra EU-27 trade, 2000-2008.PNG
Size of this preview: 800 × 323 pixels. Other resolutions: 320 × 129 pixels | 829 × 335 pixels.
Original file (829 × 335 pixels, file size: 21 KB, MIME type: image/png)
Evolution of extra EU-27 trade, 2000-2008
- value in billion euro
Graph Map Table created with data from Month Year
Most recent data available now, see:
File usage
There are no pages that use this file.