Archive:People at risk of poverty or social exclusion
Data from January 2013, most recent data: Further Eurostat information, Main tables and Database. One of the five headline targets of the Europe 2020 headline indicators is to reduce poverty by lifting at least 20 million people out of the risk of poverty or social exclusion by 2020. This article presents geographical and temporal comparisons of the monetary and non-monetary elements of the indicator that describes poverty and social exclusion using the most recent data (2010 and 2011) from the EU statistics on income and living conditions (EU-SILC). Comparisons over the most recent years enable, inter alia, analysis of the impact of the economic crisis and the austerity measures taken to overcome the crisis on the Europe2020 headline target.

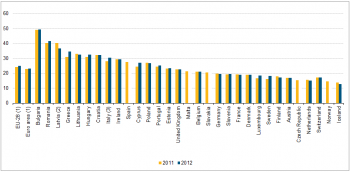
(%) - Source: Eurostat (ilc_peps01)

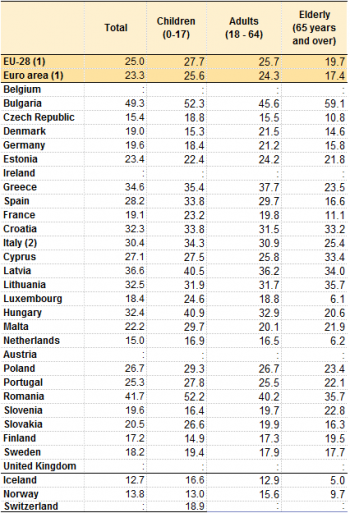
(% of specified population) - Source: Eurostat (ilc_peps01)

2010 and 2011 (%) - Source: Eurostat ilc_li02, ilc_li01/default/table?lang=en (:ilc_li10, ilc_li02, ilc_li01)

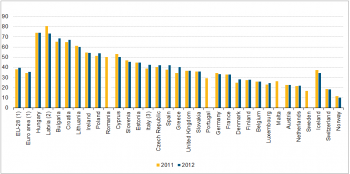
(%) - Source: Eurostat (ilc_lvhl11)

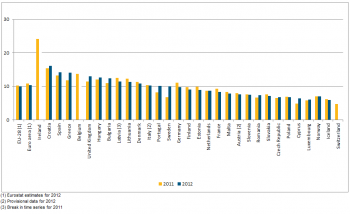
(%) - Source: Eurostat (ilc_mdes04)
Main statistical findings
In 2011, 119.6 million people, or 24.2 % (Figure 1) of the population, in the EU27 were at risk of poverty or social exclusion (AROPE), compared with 23.6 % in 2010. In 2008 the rate was also 23.6 %. The AROPE indicator is defined as the share of the population in at least one of the following three conditions: 1) at risk of poverty, meaning below the poverty threshold, 2) in a situation of severe material deprivation, 3) living in a household with a very low work intensity. The reduction of the number of persons at risk of poverty or social exclusion in the EU is one of the key targets of the Europe 2020 strategy.
The AROPE figure for the EU27 average, calculated as a weighted average of national results, masks considerable variation between Member States. At one extreme, the Member States with the highest AROPE rates were Bulgaria (49.1 %), Romania and Latvia (both around 40 %), Lithuania (33.4 %), Greece and Hungary (both 31.0 %). At the other extreme, the share of the population at risk of poverty or social exclusion was the lowest in the Czech Republic (15.3 %), the Netherlands (15.7 %) and Sweden (16.1 %), Luxembourg and Austria (16.8 and 16.9 % respectively). Overall AROPE rates have slightly increased at EU27 level between 2010 and 2011 (0.6 pp). The risk of poverty or social exclusion rose by 3.7 pp in Italy and 3.3 pp in Greece, decreasing significantly only in Romania (-1.1 pp) and Portugal (-0.9 pp).
Children and active-age people more at risk of poverty or social exclusion than elderly people in several countries
With a rate of 27.0 % in EU27 (Table 1), children were at greater risk of poverty or social exclusion in 2011 than the rest of the population in 17 of the 26 Member States for which data are available. The largest gaps (difference between the AROPE rates for the specific age groups) between children and the total population were observed in Romania, Hungary and Slovakia: in these countries the AROPE rate for children was more than 5 pp higher than the rate for the total population. The situation was relatively better for children than adults in Denmark, Finland, Germany, Slovenia, Greece and Lithuania. The situation of children compared to adults was also better in Norway and Croatia. The percentage of children living in a household at risk of poverty or social exclusion ranged from around 16 % in Sweden, Denmark and Finland to more than 40 % in Latvia, Romania and Bulgaria. The main factors affecting child poverty are the labour market situation of the parents, which is linked to their level of education (Employment statistics), the composition of the household in which the children live and the effectiveness of government intervention through income support and the provision of enabling services. There are also more vulnerable groups of children, such as those with migrant parents that deserve particular attention. The elderly faced a lower risk of poverty or social exclusion in 2011 than the overall population both at EU27 level (20.5 % as opposed to 24.2 %) and in 16 out of the 26 countries with available data. The risk of poverty or social exclusion faced by people aged 65 or more in 2011 ranged from 4.7 % in Luxembourg to 61.1 % in Bulgaria. These differences in the relative situation of the elderly depend on a number of factors including the features of the pension systems for current pensioners and the age and gender structure of the elderly population, since elderly women and the very old tend to face much higher risks in some countries.
16.9 % of the population in the EU27 at risk of income poverty
Looking at each of the three elements contributing to being at risk of poverty or social exclusion, 16.9 % of the population in the EU27 (Table 2) in 2011 were at-risk-of-poverty after social transfers, meaning that their disposable income was below their national at-risk-of-poverty threshold (At-risk-of-poverty rate). This rate has increased by 0.5 pp overall in the EU27 compared to 2010. The highest at-risk-of-poverty rates were observed in Bulgaria and Romania (22.3 and 22.2 % respectively), Spain (21.8 %) and Greece (21.4 %), and the lowest in the Czech Republic (9.8 %), the Netherlands (11.0 %), Austria (12.6 %), Denmark and Slovakia (both 13.0 %). It is important to note that the at-risk-of-poverty rate is a relative measure of poverty and that the poverty threshold varies greatly between Member States. The threshold varies also over time and in a number of Member States it has fallen in recent years due to the economic crisis. When considering country-specific situations, the risk of poverty (after social transfers) increased the most in Estonia (1.7 pp), Bulgaria (1.6 pp) and Hungary (1.5 pp) in 2011 and it decreased the most in Latvia (-2 pp). Italy, Greece, Spain, Romania, Sweden and Slovakia also had an increase between 1.0 and 1.4 pp. As for the other Member States, the magnitude of the change remained below 1 pp. In Greece and Spain, despite the sharp fall in the median income between 2010 and 2011, by 8.2 % and 4.0 % respectively, the at-risk-of-poverty rate increased. On the contrary, in Latvia the median income has also dropped significantly by 7.2 % between 2010 and 2011, while the at-risk-of poverty rate has decreased. This implies that a number of people in Latvia who were around the poverty threshold in 2010 moved above it even if their situation did not significantly change in 2011, given the lowering of the threshold caused by the fall in the median income, while in Greece and Spain median income falls and so do incomes below it in 2011. This implies that in Greece and Spain the income distribution has shifted towards lower incomes. The at-risk-of-poverty rate before social transfers measures a hypothetical situation where social transfers are absent (pensions not being considered as a social transfer). Comparing this with the standard at-risk-of-poverty rate (after social transfers) shows that such transfers have an important redistributive effect that helps to reduce the number of people who are at-risk-of-poverty. In each country, these rates are calculated with the same poverty threshold, i.e. including social transfers in the total household income. If we consider the at-risk-of-poverty rate before social transfers a slightly different picture emerges with the at-risk-of-poverty rate rising by 0.2 pp at EU level between 2010 and 2011 and significantly rising in several countries, with the largest increases in Spain (1.7 pp) and Romania (1.6 pp).
10 % of the population in the EU27 living in households with very low work intensity
Low work intensity refers to the ratio between the number of months that household members of working age (aged 18-59, not being a student aged 18-24) worked during the income reference year, and the total number of months that could theoretically have been worked by the same household members. For persons who declared that they worked part-time, the number of months in terms of full time equivalents is estimated on the basis of the number of hours usually worked at the time of the interview. People living in households with a very low work intensity are defined as people of all ages (from 0-59 years) living in households where the adults (those aged 18-59, but excluding student aged 18-24) worked less than 20 % of their total potential during the previous 12 months. Following this definition, 10.0 % (Figure 2) of the EU-27 population could be considered as living in a household with a very low work intensity in 2011 with some variation between Member States. On the one hand, only less than 6 % of the target population was living in a household with a very low work intensity in Cyprus and Luxembourg. On the other hand, the indicator exceeded 12 % in Belgium, Lithuania, Spain, Latvia and Hungary. Although overall at the EU level the indicator has remained stable between 2010 and 2011, it has increased significantly in Greece (4.3 pp), Bulgaria and Lithuania (both by 3.1 pp) and Spain (2.4 pp), while somewhat decreased mainly in the United Kingdom (-1.6 pp).
8.8 % of the population in the EU27 severely materially deprived
Material deprivation rates complement the social exclusion picture by providing an estimate of the proportion of people whose living conditions are severely affected by a lack of resources. The severe material deprivation rate represents the proportion of people who cannot afford at least four of the nine following items: 1) (arrears on) mortgage or rent payments, utility bills, hire purchase instalments or other loan payments; 2) one week’s annual holiday away from home; 3) a meal with meat, chicken, fish (or vegetarian equivalent) every second day; 4) unexpected financial expenses; 5) a telephone (including mobile phone); 6) a colour TV; 7) a washing machine; 8) a car and 9) heating to keep the home adequately warm. In the EU27, 8.8 % (Figure 3) of the population were severely materially deprived. The share of those severely materially deprived varied significantly among Member States. On the one hand, only 1.2 % of the population were severely deprived in Luxembourg and Sweden, 2.5 % in the Netherlands and 2.6 % in Denmark. On the other hand, the deprivation rate exceeded 30 % in Bulgaria and Latvia, and exceeded 20 % in Romania and Hungary. While overall at EU level, severe material deprivation increased slightly by 0.5 pp between 2010 and 2011, it had a sharper increase in Italy (4.3 pp), Greece (3.6 pp) and Latvia (3.5 pp). On the other hand, severe material deprivation rate has decreased significantly in Bulgaria (-2.1 pp), Romania (-1.6 pp) and Poland (-1.2 pp).
37.5 % of the population in the EU27 could not afford unexpected financial expenses
Among material deprivation items, facing unexpected expenses showed the greatest variation in 2011 at EU27 level compared with 2010. This item measures the ability of a household to cover from their own resources an unexpected expense amounting to a fraction (1/12) of the poverty threshold. The amount varies between countries from about €106 in Romania to about €1627 in Luxembourg. In 2011, 37.5 % of the EU27 population reported difficulties in facing such unexpected expenses. This represents an increase of 1.3 pp compared with 2010. There is considerable variation among Member States. The percentage of people reporting such difficulties ranges from 25 % or less in Denmark, Luxembourg, Austria, the Netherlands and Sweden to more than 60.0 % in Lithuania, Bulgaria and Hungary, reaching a maximum of 80.1 % in Latvia. Compared with 2010, the percentage of people reporting difficulties in facing unexpected expenses increased by more than 5 pp in Greece (6.2 pp), Romania (5.7 pp) and Italy (5.3 pp). At the same time it decreased by more than 2 pp in Austria (-2.2 pp) and Slovakia (-2.4 pp).
Data sources and availability
The data used in this section are primarily derived from data from EU statistics on income and living conditions (EU-SILC). The reference population is all private households and their current members residing in the territory of an EU Member State at the time of data collection; persons living in collective households and in institutions are generally excluded from the target population. The EU27 aggregate is a population-weighted average of individual national figures.
Context
At the Laeken European Council in December 2001, European heads of state and government endorsed a first set of common statistical indicators for social exclusion and poverty that are subject to a continuing process of refinement by the indicators sub-group (ISG) of the social protection committee (SPC). These indicators are an essential element in the open method of coordination to monitor the progress made by the EU’s Member States in alleviating poverty and social exclusion. EU-SILC is the reference source for EU statistics on income and living conditions and, in particular, for indicators concerning social inclusion. In the context of the Europe 2020 strategy, the European Council adopted in June 2010 a headline target for social inclusion – namely, that by 2020 there should be at least 20 million fewer people in the EU who are at-risk-of-poverty or social exclusion. EU-SILC is the source used to monitor progress towards this headline target, which is measured through an indicator that combines the at-risk-of-poverty rate, the severe material deprivation rate, and the proportion of people living in households with very low work intensity.
Persons at-risk-of-poverty are those living in a household with an equivalised disposable income below the risk-of-poverty threshold, which is set at 60% of the national median Equivalised disposable income (after social transfers). The equivalised income is calculated by dividing the total household income by its size determined after applying the following weights: 1.0 to the first adult, 0.5 to each other household members aged 14 or over and 0.3 to each household member aged less than 14 years old. Severely materially deprived persons have living conditions constrained by a lack of resources and experience at least 4 out of the 9 following deprivation items: cannot afford 1) to pay rent/mortgage or utility bills on time, 2) to keep home adequately warm, 3) to face unexpected expenses, 4) to eat meat, fish or a protein equivalent every second day, 5) a one week holiday away from home, 6) a car, 7) a washing machine, 8) a colour TV, or 9) a telephone (including mobile phone). People living in households with very low work intensity are those aged 0-59 who live in households where on average working age adults (aged 18-59, excluding dependent children) worked less than 20% of their total work potential during the past year The total number of people at risk of poverty or social exclusion is lower than the sum of the numbers of people in each of the three forms of poverty or social exclusion as some persons are affected simultaneously by more than one of these situations.
Further Eurostat information
Publications
- In 2009 a 6.5 % rise in per capita social protection expenditure matched a 6.1 % drop in EU-27 GDP Statistics in focus 14/2012
- 23 % of EU citizens were at risk of poverty or social exclusion in 2010 Statistics in focus 9/2012
- In 2011, 24% of the population were at risk of poverty or social exclusion News releases
- The 9 poorest countries catching up on income per capita Statistics in focus 16/2011
- In 2010, 23% of the population were at risk of poverty or social exclusion News releases
Main tables
Database
- Living conditions and welfare (livcon), see:
- http://ec.europa.eu/eurostat/web/income-and-living-conditions/data/database
- People at risk of poverty or social exclusion (Europe 2020 strategy) (ilc_pe)
- Main indicator - Europe 2020 target on poverty and social exclusion (ilc_peps)
- Income distribution and monetary poverty (ilc_ip)
- Monetary poverty (ilc_li)
- Living conditions (ilc_lv)
- Health and labour conditions (ilc_lvhl)
- Material deprivation (ilc_md)
- Material deprivation by dimension (ilc_mddd)
- Economic strain (ilc_mdes)
- People at risk of poverty or social exclusion (Europe 2020 strategy) (ilc_pe)
Dedicated section
Source data for tables and figures (MS Excel)
Methodology
- Income and living conditions (ESMS metadata file - ilc_esms)
- Measuring material deprivation in the EU — Indicators for the whole population and child-specific indicators Methodologies and working papers
Other information
- Regulation 1177/2003 of 16 June 2003 concerning Community statistics on income and living conditions (EU-SILC)
- Regulation 1553/2005 of 7 September 2005 amending Regulation 1177/2003 concerning Community statistics on income and living conditions (EU-SILC)
- Regulation 1791/2006 of 20 November 2006 adapting certain Regulations and Decisions in the fields of ... statistics, ..., by reason of the accession of Bulgaria and Romania
External links
- The social dimension of the EUROPE 2020 strategy - A report of the social protection committee (2011)
- EU Employment and Social Situation Quarterly Review - December 2011
- OECD - Better Life Initiative: Measuring Well-being and Progress
- OECD - StatExtracts - Income distribution - Inequality: Income distribution - Inequality - Country tables
- Employment and Social Developments in Europe (2011)
