Archive:Trends in consumer prices
- Data from August 2009, most recent data: Further Eurostat information, Main tables and Database.
Consumer price indices (CPIs) measure the changes over time in the prices of consumer goods and services acquired, used or paid for by households. CPIs have a variety of potential uses, for example in indexing commercial contracts, wages, social protection benefits or financial instruments and as inputs into various types of economic analysis.
The Harmonized Indices of Consumer Prices are a set of European Union (EU) consumer price indices calculated according to a harmonized approach and a single set of definitions. HICPs have been set up to provide the best measure for international comparisons of consumer price inflation in the European Union (EU) and the euro area and for assessing price convergence and stability in monetary policy analysis. Since 1999, when the euro area was created, the main focus of interest of the European Central Bank (ECB) has been assessing price stability in the euro area. The ECB defines price stability as an annual increase in the HICP for the euro area of close to but below 2 %.
Main statistical findings
Trends in consumer price inflation 2001–2008
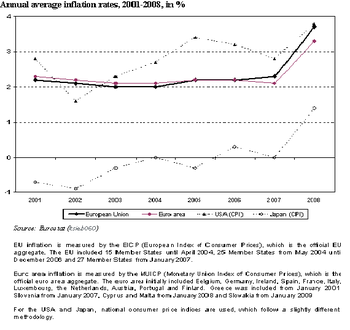
In 2008, the highest ever annual average inflation rate was recorded for the euro area: 3.3 %. This high rate followed several years of relative stability at around 2.2 %. The inflation in 2008 can be explained by steep increases in energy and food prices between autumn 2007 and autumn 2008. Looking at the monthly figures, annual inflation was actually above 3 % from November 2007 until October 2008 and reached its peak in June and July at 4.0 %. In the second half of 2008 a substantial decline in these rates was recorded, falling to 0.6 % in March 2009.
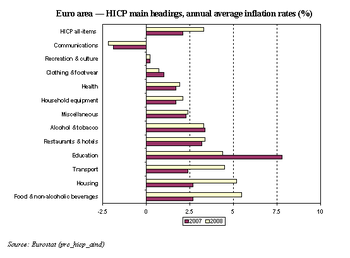
Consumer prices for food, in particular, recorded extraordinary inflation rates in 2008 with an annual average of 5.7 %. This was significantly above the price increases recorded for food products since 2001, when annual average inflation reached 5.3 % at the time of the out-breaks of BSE and food-and-mouth disease. Food price increases in 2008 might be explained by the sharp price increases in milk, cheese and eggs and in oil and fats. Towards the end of 2008, food price inflation decreased and stood at 1.6 % in March 2009. For both sub-categories ‘milk, cheese and eggs’ and ‘oil and fats’, annual inflation rates actually turned negative at the beginning of 2009.
In 2008, the three main headings with the largest weights in household final monetary consumption expenditure for the euro area showed annual average rates above the overall inflation rate of 3.3 %. These were Food and non-alcoholic beverages (5.5 %), Housing (5.2 %), and Transport (4.5 %). Other components with upward impacts on inflation were Education (4.4 %), and Restaurants and hotels (3.4 %). Downward impacts on overall inflation in the euro area came mainly from Communications (-2.2 %), Recreation and culture (0.2 %), and Clothing and footwear (0.7 %)
In the EU as a whole, annual average inflation in 2008 was at 3.7 %. It had been below euro area inflation until 2004, while the EU had 15 Member States. Then in 2005 and 2006 both country groups showed the same annual average inflation rates and in 2007 and 2008 EU inflation went above that in the euro area. The more detailed monthly data show that summer 2006 was the turning point, when EU inflation actually went above that of the euro area.
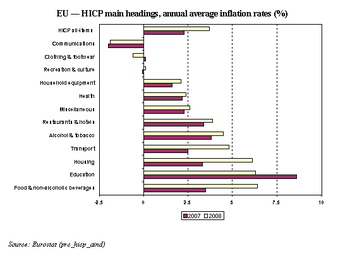
In 2008, when the inflation rate in the European Union was 3.7 % and the EU had 27 Member States, the highest annual average inflation rates were recorded for Latvia (15.3 %), Bulgaria (12.0 %) and Lithuania (11.1 %). The main components with high rates in 2008 in the European Union were Food and non-alcoholic beverages (6.4 %), Education (6.3 %), and Housing (6.1 %), and those with the lowest rates were Communications (-1.9 %), Clothing and footwear (-0.6 %), and Recreation and culture (0.1 %).
The nine highest annual average inflation rates for 2008 among the 27 EU Member States were those of countries that had joined the EU in 2004 or 2007. Iceland, a Member State of the European Economic Area (EEA), with an inflation rate of 12.8 %, was also placed among countries with the highest inflation rates due to its falling currency as a consequence of the heavily-indebted banking system. Within the EU, the lowest rates were recorded for the Netherlands (2.2 %), Portugal (2.7 %) and Germany (2.8 %).
Permanent versus transitory changes
There are many prices that substantially affect the overall index and that may quickly reverse, so that such changes are transitory and volatile. Experts are always trying to construct inflation measures to be independent of these effects (short-term changes in energy prices, fresh fruit and vegetables) but to reflect that part of inflation caused by monetary effects or permanent price changes.
Special aggregates enable detection of the factors responsible for certain behaviours of inflation rates. In order to facilitate medium-term decisions by the European Central Bank, Eurostat releases a series of special aggregates, including:
- HICP all items excluding energy;
- HICP all items excluding energy, food, alcohol and tobacco;
- HICP all items excluding energy and unprocessed food;
- HICP all items excluding energy and seasonal food;
- HICP all items excluding tobacco;
- Energy
- Food, alcohol and tobacco.
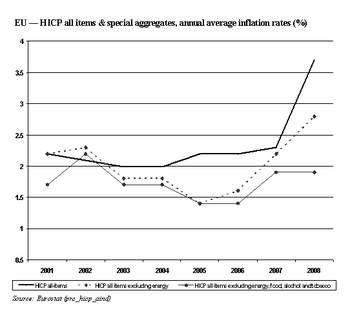
When price changes are measured excluding energy or food, alcohol and tobacco, or both, inflation rates can show trends different from that of overall inflation. In 2005, when the overall inflation rate was going up, inflation rates measured excluding both energy and the food, alcohol and tobacco group were falling. This can be explained by the fact that price changes in these groups had significant upward impacts on overall inflation. In 2008, inflation measured excluding energy, food, alcohol and tobacco was 1.9 % and remained unchanged compared with the previous year. However, the headline HICP inflation rate increased from 2.3 % in 2007 to 3.7 % in 2008. This was caused by the substantial upward impacts of both energy and food (0.9 % each) on the all-items rate.
Data sources and availability
The inflation rate is calculated from harmonized indices of consumer prices – it equates to the all-items harmonized index of consumer prices. Harmonized indices of consumer prices (HICPs) are presented with a common reference year, which is currently 2005=100. Normally the indices are used to create percentage changes that show price increases/decreases for the period in question. Although the rates of change shown in this publication are annual averages, the basic indices are compiled on a monthly basis and are published at this frequency by Eurostat. Eurostat publishes HICPs some 14 to 16 days after the end of the reporting month, with these series starting in the mid-1990s.
HICPs cover practically every good and service that may be purchased by households in the form of final monetary consumption expenditure. Owner occupied housing is, however, not yet reflected in the HICPs. The different goods and services are classified according to an international classification of individual consumption by purpose, known as COICOP/HICP. At its most disaggregated level, Eurostat publishes around 100 sub-indices, which can be aggregated to broad categories of goods and services.
Further Eurostat information
Publications
Main tables
Database
- Prices, see:
- Harmonized indices of consumer prices
Dedicated section
Other information
- Compendium of HICP reference documents - (2/2001/B/5)
- Harmonized indices of consumer prices (HICPs) – A short guide for users


