,_1990-2010,_EU_27.png)
, 1990-2010, EU 27.png&body=Statistics Explained - Change in aggregated emissions of methane and nitrous oxide from agriculture sector (%), 1990-2010, EU 27.png %0A https%3A%2F%2Fec.europa.eu%2Feurostat%2Fstatistics-explained%2Findex.php%3Ftitle%3DFile%3AChange_in_aggregated_emissions_of_methane_and_nitrous_oxide_from_agriculture_sector_%28%2525%29%2C_1990-2010%2C_EU_27.png)
File:Change in aggregated emissions of methane and nitrous oxide from agriculture sector (%), 1990-2010, EU 27.png
,_1990-2010,_EU_27.png&diff=prev&oldid=118070)
,_1990-2010,_EU_27.png&direction=prev&oldid=118070)
No higher resolution available.
Change_in_aggregated_emissions_of_methane_and_nitrous_oxide_from_agriculture_sector_(%),_1990-2010,_EU_27.png (794 × 419 pixels, file size: 6 KB, MIME type: image/png)
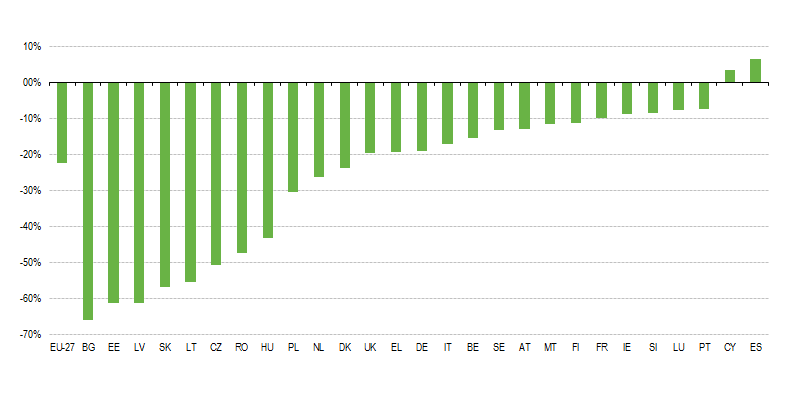
Change in aggregated emissions of methane and nitrous oxide from agriculture sector (%), 1990-2010, EU 27
Graph created with data from 2010.
Data extracted in November 2012. Most recent data available at:
http://www.eea.europa.eu/publications/european-union-greenhouse-gas-inventory-2011
File usage
There are no pages that use this file.
,_1990-2010,_EU_27.png&oldid=118070)
,_1990-2010,_EU_27.png)
,_1990-2010,_EU_27.png&action=edit&redlink=1)
,_1990-2010,_EU_27.png&action=history)