,_2010,_EU_27.png)
, 2010, EU 27.png&body=Statistics Explained - Aggregated emissions of CH4 and N2O per Utilised Agricultural Area (kilotonnes CO2 equivalent per 1000 ha), 2010, EU 27.png %0A https%3A%2F%2Fec.europa.eu%2Feurostat%2Fstatistics-explained%2Findex.php%3Ftitle%3DFile%3AAggregated_emissions_of_CH4_and_N2O_per_Utilised_Agricultural_Area_%28kilotonnes_CO2_equivalent_per_1000_ha%29%2C_2010%2C_EU_27.png)
File:Aggregated emissions of CH4 and N2O per Utilised Agricultural Area (kilotonnes CO2 equivalent per 1000 ha), 2010, EU 27.png
,_2010,_EU_27.png&diff=prev&oldid=110445)
,_2010,_EU_27.png&direction=prev&oldid=110445)
Size of this preview: 800 × 404 pixels. Other resolutions: 320 × 162 pixels | 828 × 418 pixels.
Original file (828 × 418 pixels, file size: 5 KB, MIME type: image/png)
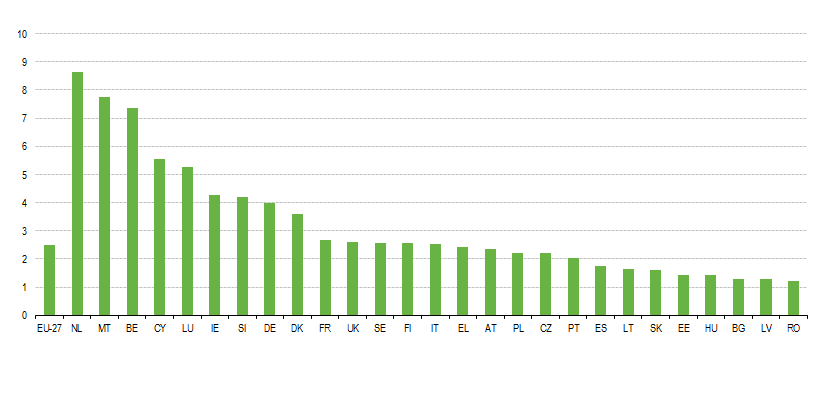
Aggregated emissions of CH4 and N2O per Utilised Agricultural Area (kilotonnes CO2 equivalent per 1000 ha), 2010, EU 27
Graph created with data from 2010.
Data extracted in November 2012. Most recent data available at:
http://www.eea.europa.eu/pressroom/data-and-maps/data/data-viewers/greenhouse-gases-viewer
http://ec.europa.eu/agriculture/statistics/agricultural/2011/index_en.htm
File usage
There are no pages that use this file.
,_2010,_EU_27.png&oldid=110445)
,_2010,_EU_27.png)
,_2010,_EU_27.png&action=edit&redlink=1)
,_2010,_EU_27.png&action=history)