_(2006%3D100)_partA-de.png)
 (2006=100) partA-de.png&body=Statistics Explained - Output price indices, selected service activities, EU-27, 2006-2011 (1) (2006=100) partA-de.png %0A https%3A%2F%2Fec.europa.eu%2Feurostat%2Fstatistics-explained%2Findex.php%3Ftitle%3DFile%3AOutput_price_indices%2C_selected_service_activities%2C_EU-27%2C_2006-2011_%281%29_%282006%253D100%29_partA-de.png)
File:Output price indices, selected service activities, EU-27, 2006-2011 (1) (2006=100) partA-de.png
Revision as of 16:03, 18 October 2012 by EXT-Z-Konstantinou (talk | contribs) (Abbildung 3a: Erzeugerpreisindizes, ausgewählte Dienstleistungsbranchen, EU-27, 2006-2011 (1)<br>(2006=100) – Quelle: Eurostat{{Stable link|title=|code=sts_sepp_q}})
No higher resolution available.
Output_price_indices,_selected_service_activities,_EU-27,_2006-2011_(1)_(2006=100)_partA-de.png (573 × 325 pixels, file size: 9 KB, MIME type: image/png)
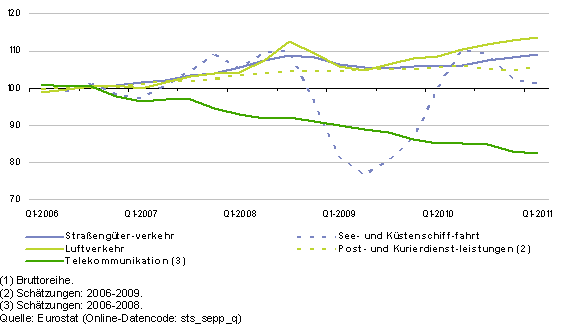
Abbildung 3a: Erzeugerpreisindizes, ausgewählte Dienstleistungsbranchen, EU-27, 2006-2011 (1)
(2006=100) – Quelle: Eurostat (sts_sepp_q)
File usage
There are no pages that use this file.
_(2006%3D100)_partA-de.png&oldid=105309)
_(2006%3D100)_partA-de.png)
_(2006%3D100)_partA-de.png&action=edit&redlink=1)
_(2006%3D100)_partA-de.png&action=history)