_(%25)-fr.png)
 (%)-fr.png&body=Statistics Explained - Gross operating rate within the non-financial business economy, EU-27, 2008 (1) (%)-fr.png %0A https%3A%2F%2Fec.europa.eu%2Feurostat%2Fstatistics-explained%2Findex.php%3Ftitle%3DFile%3AGross_operating_rate_within_the_non-financial_business_economy%2C_EU-27%2C_2008_%281%29_%28%2525%29-fr.png)
File:Gross operating rate within the non-financial business economy, EU-27, 2008 (1) (%)-fr.png
Revision as of 10:48, 17 October 2012 by EXT-Z-Konstantinou (talk | contribs) (Graphique 4: Taux brut d’exploitation dans l’économie marchande non financière, UE-27, 2008 (1)<br>(en %) - Source: Eurostat {{Stable link|title=|code=sbs_na_ind_r2}}, {{Stable link|title=|code=sbs_na_con_r2}}, {{Stable link|title=|code=sbs_na_dt_r2)
No higher resolution available.
Gross_operating_rate_within_the_non-financial_business_economy,_EU-27,_2008_(1)_(%)-fr.png (573 × 322 pixels, file size: 12 KB, MIME type: image/png)
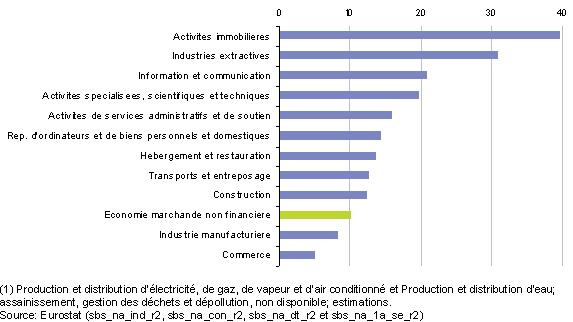
Graphique 4: Taux brut d’exploitation dans l’économie marchande non financière, UE-27, 2008 (1)
(en %) - Source: Eurostat (sbs_na_ind_r2), (sbs_na_con_r2), (sbs_na_dt_r2) et (sbs_na_1a_se_r2)
File usage
There are no pages that use this file.
_(%25)-fr.png&oldid=105002)
_(%25)-fr.png)
_(%25)-fr.png&action=edit&redlink=1)
_(%25)-fr.png&action=history)