_(tonnes_of_NMVOC-equivalents_of_NOx,_NMVOC,_CO_and_CH4_per_EUR_million_of_gross_value_added_at_basic_prices)-de.png)
 (tonnes of NMVOC-equivalents of NOx, NMVOC, CO and CH4 per EUR million of gross value added at basic prices)-de.png&body=Statistics Explained - Tropospheric ozone precursors intensity, analysis by economic activity, EU-27, 1998 and 2008 (1) (tonnes of NMVOC-equivalents of NOx, NMVOC, CO and CH4 per EUR million of gross value added at basic prices)-de.png %0A https%3A%2F%2Fec.europa.eu%2Feurostat%2Fstatistics-explained%2Findex.php%3Ftitle%3DFile%3ATropospheric_ozone_precursors_intensity%2C_analysis_by_economic_activity%2C_EU-27%2C_1998_and_2008_%281%29_%28tonnes_of_NMVOC-equivalents_of_NOx%2C_NMVOC%2C_CO_and_CH4_per_EUR_million_of_gross_value_added_at_basic_prices%29-de.png)
File:Tropospheric ozone precursors intensity, analysis by economic activity, EU-27, 1998 and 2008 (1) (tonnes of NMVOC-equivalents of NOx, NMVOC, CO and CH4 per EUR million of gross value added at basic prices)-de.png
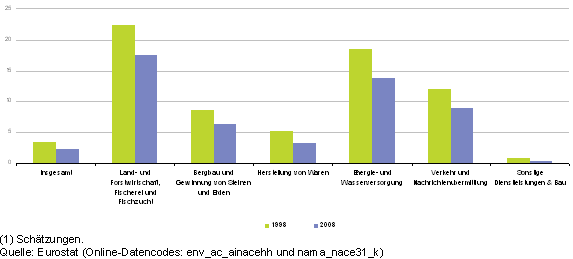
Revision as of 12:22, 2 October 2012 by EXT-Z-Konstantinou (talk | contribs) (Abbildung 6: Intensität der Vorläuferstoffe von troposphärischem Ozon, Analyse nach Wirtschaftszweigen, EU-27, 1998 und 2008 (1)<br />(in Tonnen von NMVOC-Äquivalenten von NO<sub>x</sub>, NMVOC, CO and CH<sub>4</sub> je Mio. EUR Bruttowertschöpf)
No higher resolution available.
Tropospheric_ozone_precursors_intensity,_analysis_by_economic_activity,_EU-27,_1998_and_2008_(1)_(tonnes_of_NMVOC-equivalents_of_NOx,_NMVOC,_CO_and_CH4_per_EUR_million_of_gross_value_added_at_basic_prices)-de.png (573 × 259 pixels, file size: 8 KB, MIME type: image/png)
Abbildung 6: Intensität der Vorläuferstoffe von troposphärischem Ozon, Analyse nach Wirtschaftszweigen, EU-27, 1998 und 2008 (1)
(in Tonnen von NMVOC-Äquivalenten von NOx, NMVOC, CO and CH4 je Mio. EUR Bruttowertschöpfung zu Herstellungspreisen) – Quelle: Eurostat (env_ac_ainacehh) und (nama_nace31_k)
File usage
There are no pages that use this file.
_(tonnes_of_NMVOC-equivalents_of_NOx,_NMVOC,_CO_and_CH4_per_EUR_million_of_gross_value_added_at_basic_prices)-de.png&oldid=103209)
_(tonnes_of_NMVOC-equivalents_of_NOx,_NMVOC,_CO_and_CH4_per_EUR_million_of_gross_value_added_at_basic_prices)-de.png)
_(tonnes_of_NMVOC-equivalents_of_NOx,_NMVOC,_CO_and_CH4_per_EUR_million_of_gross_value_added_at_basic_prices)-de.png&action=edit&redlink=1)
_(tonnes_of_NMVOC-equivalents_of_NOx,_NMVOC,_CO_and_CH4_per_EUR_million_of_gross_value_added_at_basic_prices)-de.png&action=history)