File:Emissions of acidifying substances, analysis by activity, EU-27, 1998 and 2008 (1) (% of total, based on tonnes of SO2 acid equivalents of SOx, NH3 and NOx)-de.png
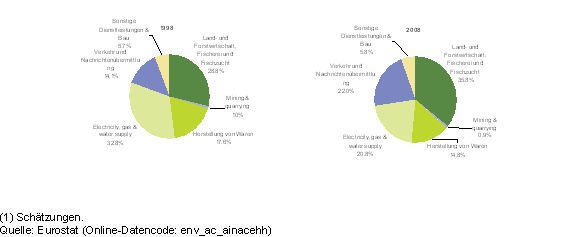
Revision as of 12:09, 2 October 2012 by EXT-Z-Konstantinou (talk | contribs) (Abbildung 2: Zur Versauerung beitragende Emissionen, Analyse nach Wirtschaftszweigen, EU-27, 1998 und 2008 (1)<br />(in % des Gesamtwerts, auf Grundlage der SO<sub>2</sub> -Versauerungsäquivalente von SO<sub>x</sub>, NH<sub>3</sub> und NO<sub>x</sub)
Emissions_of_acidifying_substances,_analysis_by_activity,_EU-27,_1998_and_2008_(1)_(%_of_total,_based_on_tonnes_of_SO2_acid_equivalents_of_SOx,_NH3_and_NOx)-de.png (573 × 237 pixels, file size: 10 KB, MIME type: image/png)
Abbildung 2: Zur Versauerung beitragende Emissionen, Analyse nach Wirtschaftszweigen, EU-27, 1998 und 2008 (1)
(in % des Gesamtwerts, auf Grundlage der SO2 -Versauerungsäquivalente von SOx, NH3 und NOx in Tonnen) – Quelle: Eurostat (env_ac_ainacehh)
File usage
There are no pages that use this file.
