_(%25_of_total,_based_on_tonnes_of_CO2_equivalents_of_CO2,_CH4_and_N2O)-de.png)
 (% of total, based on tonnes of CO2 equivalents of CO2, CH4 and N2O)-de.png&body=Statistics Explained - Greenhouse gas emissions, analysis by activity, EU-27, 1998 and 2008 (1) (% of total, based on tonnes of CO2 equivalents of CO2, CH4 and N2O)-de.png %0A https%3A%2F%2Fec.europa.eu%2Feurostat%2Fstatistics-explained%2Findex.php%3Ftitle%3DFile%3AGreenhouse_gas_emissions%2C_analysis_by_activity%2C_EU-27%2C_1998_and_2008_%281%29_%28%2525_of_total%2C_based_on_tonnes_of_CO2_equivalents_of_CO2%2C_CH4_and_N2O%29-de.png)
File:Greenhouse gas emissions, analysis by activity, EU-27, 1998 and 2008 (1) (% of total, based on tonnes of CO2 equivalents of CO2, CH4 and N2O)-de.png
Revision as of 12:05, 2 October 2012 by EXT-Z-Konstantinou (talk | contribs) (Abbildung 1: Treibhausgasemissionen, Analyse nach Wirtschaftszweigen, EU-27, 1998 und 2008 (1)<br />(in % des Gesamtwerts, auf Grundlage der CO2-Äquivalente von CO<sub>2</sub>, CH<sub>4</sub> und N<sub>2</sub>O in Tonnen) – Quelle: Eurostat{{Stabl)
No higher resolution available.
Greenhouse_gas_emissions,_analysis_by_activity,_EU-27,_1998_and_2008_(1)_(%_of_total,_based_on_tonnes_of_CO2_equivalents_of_CO2,_CH4_and_N2O)-de.png (573 × 175 pixels, file size: 9 KB, MIME type: image/png)
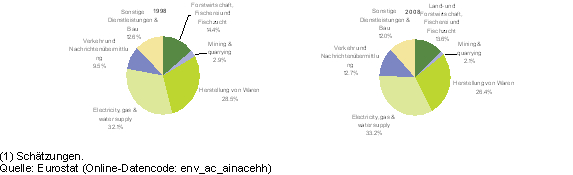
Abbildung 1: Treibhausgasemissionen, Analyse nach Wirtschaftszweigen, EU-27, 1998 und 2008 (1)
(in % des Gesamtwerts, auf Grundlage der CO2-Äquivalente von CO2, CH4 und N2O in Tonnen) – Quelle: Eurostat (env_ac_ainacehh)
File usage
There are no pages that use this file.
_(%25_of_total,_based_on_tonnes_of_CO2_equivalents_of_CO2,_CH4_and_N2O)-de.png&oldid=103202)
_(%25_of_total,_based_on_tonnes_of_CO2_equivalents_of_CO2,_CH4_and_N2O)-de.png)
_(%25_of_total,_based_on_tonnes_of_CO2_equivalents_of_CO2,_CH4_and_N2O)-de.png&action=edit&redlink=1)
_(%25_of_total,_based_on_tonnes_of_CO2_equivalents_of_CO2,_CH4_and_N2O)-de.png&action=history)