-fr.png)
-fr.png&body=Statistics Explained - Gross inland consumption, EU-27, 1999-2009 (% of total consumption)-fr.png %0A https%3A%2F%2Fec.europa.eu%2Feurostat%2Fstatistics-explained%2Findex.php%3Ftitle%3DFile%3AGross_inland_consumption%2C_EU-27%2C_1999-2009_%28%2525_of_total_consumption%29-fr.png)
File:Gross inland consumption, EU-27, 1999-2009 (% of total consumption)-fr.png
Revision as of 10:36, 13 September 2012 by EXT-Z-Konstantinou (talk | contribs) (Graphique 1: Consommation intérieure brute, UE-27, 1999-2009<br>(en % de la consommation totale) - Source: Eurostat {{Stable link|title=|code=ten00086}}, {{Stable link|title=|code=nrg_102a}}, {{Stable link|title=|code=nrg_103a}}, {{Stable link|title=|cod)
-fr.png)
-fr.png&diff=cur&oldid=101132)
-fr.png&direction=next&oldid=101132)
-fr.png&diff=next&oldid=101132)
No higher resolution available.
Gross_inland_consumption,_EU-27,_1999-2009_(%_of_total_consumption)-fr.png (573 × 220 pixels, file size: 6 KB, MIME type: image/png)
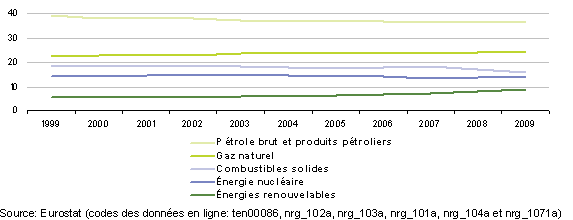
Graphique 1: Consommation intérieure brute, UE-27, 1999-2009
(en % de la consommation totale) - Source: Eurostat (ten00086), (nrg_102a), (nrg_103a), (nrg_101a), (nrg_104a) et (nrg_106a)
File usage
There are no pages that use this file.
-fr.png&oldid=101132)
-fr.png&action=edit&redlink=1)
-fr.png&action=history)