-fr.png)
-fr.png&body=Statistics Explained - Gross domestic expenditure on R&D in the Triad, 1999-2009 (% share of GDP)-fr.png %0A https%3A%2F%2Fec.europa.eu%2Feurostat%2Fstatistics-explained%2Findex.php%3Ftitle%3DFile%3AGross_domestic_expenditure_on_R%2526D_in_the_Triad%2C_1999-2009_%28%2525_share_of_GDP%29-fr.png)
File:Gross domestic expenditure on R&D in the Triad, 1999-2009 (% share of GDP)-fr.png
Revision as of 17:02, 7 September 2012 by EXT-H-McCormack (talk | contribs) (Graphique 1: Dépenses intérieures brutes de R & D dans la Triade, 1999-2009<br>(en % du PIB) - Source: Eurostat, {{Stable link|title=|code=t2020_20}}, OCDE)
No higher resolution available.
Gross_domestic_expenditure_on_R&D_in_the_Triad,_1999-2009_(%_share_of_GDP)-fr.png (668 × 396 pixels, file size: 11 KB, MIME type: image/png)
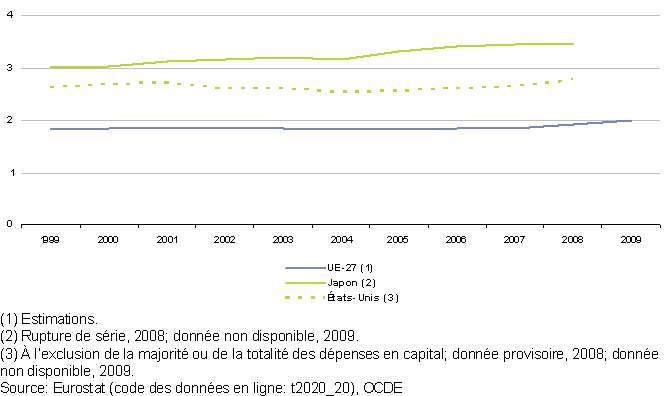
Graphique 1: Dépenses intérieures brutes de R & D dans la Triade, 1999-2009
(en % du PIB) - Source: Eurostat, (t2020_20), OCDE
File usage
There are no pages that use this file.
-fr.png&oldid=100408)
-fr.png)
-fr.png&action=edit&redlink=1)
-fr.png&action=history)