-de.png)
-de.png&body=Statistics Explained - Gross domestic expenditure on R&D by source of funds, 2004 and 2009 (% of total gross expenditure on R&D)-de.png %0A https%3A%2F%2Fec.europa.eu%2Feurostat%2Fstatistics-explained%2Findex.php%3Ftitle%3DFile%3AGross_domestic_expenditure_on_R%2526D_by_source_of_funds%2C_2004_and_2009_%28%2525_of_total_gross_expenditure_on_R%2526D%29-de.png)
File:Gross domestic expenditure on R&D by source of funds, 2004 and 2009 (% of total gross expenditure on R&D)-de.png
Revision as of 17:01, 7 September 2012 by EXT-H-McCormack (talk | contribs) (Tabelle 3: Bruttoinlandsaufwendungen für FuE nach Mittelherkunft, 2004 und 2009<br>(in % der Bruttoinlandsaufwendungen für FuE) – Quelle: Eurostat {{Stable link|title=|code=t2020_20}}, OECD)
Size of this preview: 527 × 599 pixels. Other resolutions: 211 × 240 pixels | 534 × 607 pixels.
Original file (534 × 607 pixels, file size: 34 KB, MIME type: image/png)
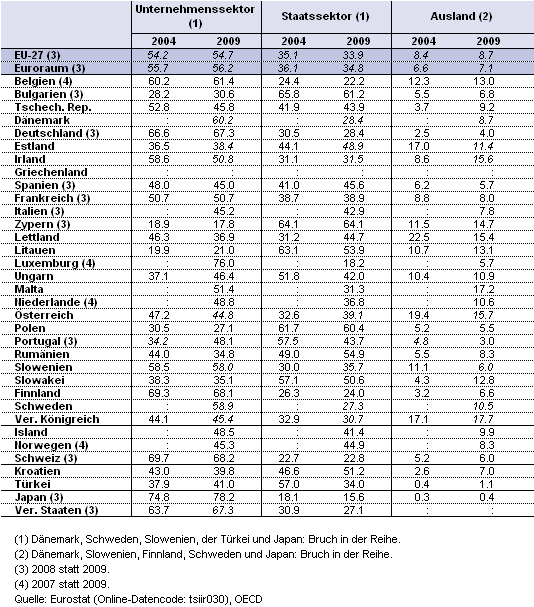
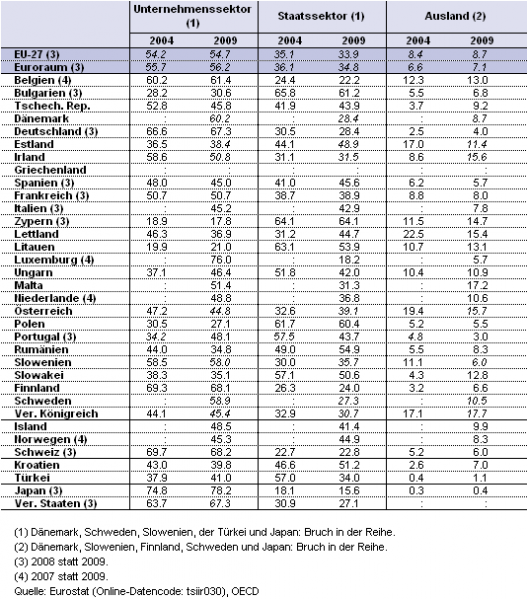
Tabelle 3: Bruttoinlandsaufwendungen für FuE nach Mittelherkunft, 2004 und 2009
(in % der Bruttoinlandsaufwendungen für FuE) – Quelle: Eurostat (t2020_20), OECD
File usage
There are no pages that use this file.
-de.png&oldid=100402)
-de.png)
-de.png&action=edit&redlink=1)
-de.png&action=history)