,_EU-27,_EFTA,_Candidate_and_Potential_Candidate_Countries.png)
, EU-27, EFTA, Candidate and Potential Candidate Countries.png&body=Statistics Explained - Change in land use from agriculture to artificial surfaces between 2000 and 2006 as a percentage of agricultural area (in 2000), EU-27, EFTA, Candidate and Potential Candidate Countries.png %0A https%3A%2F%2Fec.europa.eu%2Feurostat%2Fstatistics-explained%2Findex.php%3Ftitle%3DFile%3AChange_in_land_use_from_agriculture_to_artificial_surfaces_between_2000_and_2006_as_a_percentage_of_agricultural_area_%28in_2000%29%2C_EU-27%2C_EFTA%2C_Candidate_and_Potential_Candidate_Countries.png)
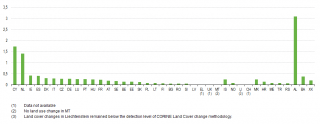
File:Change in land use from agriculture to artificial surfaces between 2000 and 2006 as a percentage of agricultural area (in 2000), EU-27, EFTA, Candidate and Potential Candidate Countries.png
,_EU-27,_EFTA,_Candidate_and_Potential_Candidate_Countries.png&diff=prev&oldid=100365)
,_EU-27,_EFTA,_Candidate_and_Potential_Candidate_Countries.png&direction=prev&oldid=100365)
,_EU-27,_EFTA,_Candidate_and_Potential_Candidate_Countries.png)
,_EU-27,_EFTA,_Candidate_and_Potential_Candidate_Countries.png&diff=cur&oldid=100365)
,_EU-27,_EFTA,_Candidate_and_Potential_Candidate_Countries.png&direction=next&oldid=100365)
,_EU-27,_EFTA,_Candidate_and_Potential_Candidate_Countries.png&diff=next&oldid=100365)

Size of this preview: 800 × 311 pixels. Other resolutions: 320 × 124 pixels | 989 × 384 pixels.
Original file (989 × 384 pixels, file size: 8 KB, MIME type: image/png)
Change in land use from agriculture to artificial surfaces between 2000 and 2006 as a percentage of agricultural area (in 2000), EU-27, EFTA, Candidate and Potential Candidate Countries.png
Graph created with data from 2000 to 2006
Data extracted at 13/07/2012. Most recent data available at:
European Environment Agency
Datafiles
Data viewer
File usage
There are no pages that use this file.
,_EU-27,_EFTA,_Candidate_and_Potential_Candidate_Countries.png&oldid=100365)
,_EU-27,_EFTA,_Candidate_and_Potential_Candidate_Countries.png&action=edit&redlink=1)
,_EU-27,_EFTA,_Candidate_and_Potential_Candidate_Countries.png&action=history)