Archive:Mining of metal ores statistics - NACE Rev. 2
- Data from April 2012. Most recent data: Further Eurostat information, Main tables and Database.
This article presents an overview of statistics for the mining of metal ores in the European Union (EU), covering NACE Rev. 2 Division 07.

- Source: Eurostat (sbs_na_ind_r2)

- Source: Eurostat (sbs_na_ind_r2)

- Source: Eurostat (sbs_na_ind_r2)

- Source: Eurostat (sbs_na_ind_r2)
Main statistical findings
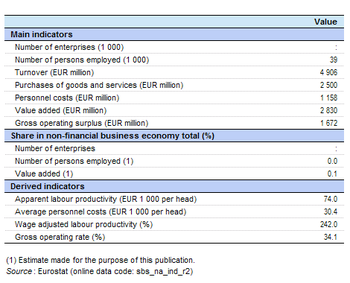
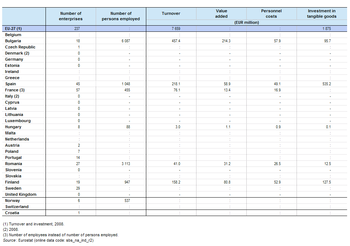
There were approximately 240 enterprises operating with mining of metal ores (Division 07) as their main activity in the EU-27 in 2009. The sector is composed of the mining of iron ores (Group 07.1) and the mining of non-ferrous metal ores (Group 07.2). Data availability for iron ore mining is relatively limited and the analysis presented in this structural profile focuses on the mining of non-ferrous metal ores.
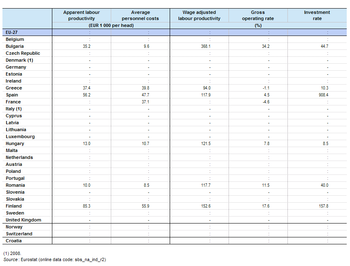
Around 38.5 thousand persons were employed in the mining of non-ferrous metal ores in the EU-27 in 2009, equivalent to 6.0 % of all persons employed in mining and quarrying (Section B). They generated EUR 2 830 million of value added which was 3.9 % of the mining and quarrying total. The apparent labour productivity of the EU-27's mining of non-ferrous metal ores subsector in 2009 was EUR 74 thousand per person employed, well above the non-financial business economy average of EUR 41.6 thousand per person employed and the mining and quarrying average of EUR 112 thousand per person employed. Despite this high apparent labour productivity the average personnel costs within the EU-27’s mining of non-ferrous metal ores subsector were not high, averaging EUR 30.4 thousand per employee which was in line with the EUR 30.0 thousand per employee average for the non-financial business economy. Apparent labour productivity was equivalent to 242.0 % of the average personnel costs (this is the wage-adjusted labour productivity ratio) in the EU-27's mining of non-ferrous metal ores subsector in 2009, a level that was well above the non-financial business economy average (138.8 %) but below the mining and quarrying average (321.4 %). The gross operating rate (which is the gross operating surplus in relation to turnover) stood at 34.1 % for the EU-27’s mining of non-ferrous metal ores subsector in 2009, around three and a half times as high as the non-financial business economy average (9.7 %) and above the 26.6 % average for the whole of the mining and quarrying sector.
Data sources and availability
The analysis presented in this article is based on the main dataset for structural business statistics (SBS) which are disseminated annually. The series provides information for each Member State as well as a number of non-member countries at a detailed level according to the activity classification NACE. Data are available for a wide range of variables.
Context
This article presents an overview of statistics for the mining of metal ores sector in the EU, covering NACE Rev. 2 Division 07. This division includes mining for metallic minerals (ores), performed through underground or open-cast extraction, seabed mining and so on. Also included are ore dressing and operations such as crushing, grinding, washing, drying, sintering, calcining (thermal treatment) or leaching ore, gravity separation or flotation operations.
Non-ferrous metal ores include uranium and thorium ores as well as other non-ferrous metal ores such as aluminium (bauxite), copper, lead, zinc, tin, manganese, chrome, nickel, cobalt, molybdenum, tantalum, vanadium and precious metals (for example, gold, silver, platinum).
This NACE Division is composed of two Groups:
- the mining of iron ores (Group 07.1);
- and the mining of non-ferrous metal ores (Group 07.2).
Excluded are: extraction and preparation of pyrites and pyrrhotite (Division 08, other mining and quarrying), roasting of iron pyrites and enrichment of uranium and thorium ores (Division 20, chemicals manufacturing), the production of aluminium oxide, mattes of copper or of nickel, smelting and refining of uranium, and operation of blast furnaces (Division 24, basic metals manufacturing).
Further Eurostat information
Publications
Main tables
Database
- SBS - industry and construction (sbs_ind_co)
- Annual detailed enterprise statistics - industry and construction (sbs_na_ind)
- Annual detailed enterprise statistics for industry (NACE Rev.2 B-E) (sbs_na_ind_r2)
- Preliminary results on industry and construction, main indicators (NACE Rev.2) (sbs_na_r2preli)
- SMEs - Annual enterprise statistics broken down by size classes - industry and construction (sbs_sc_ind)
- Industry broken down by employment size classes (NACE Rev.2 B-E) (sbs_sc_ind_r2)
- Annual detailed enterprise statistics - industry and construction (sbs_na_ind)
- SBS - regional data - all activities (sbs_r)
- SBS data by NUTS 2 regions and NACE Rev.2, from 2008 onwards (sbs_r_nuts06_r2)
Dedicated section
Methodology / Metadata
- Name of the destination ESMS metadata file (ESMS metadata file - ESMS code, e.g. bop_fats_esms)
- Title of the publication
Source data for tables, figures and maps (MS Excel)
Other information
- Regulation 58/1997 of 20 December 1996 concerning structural business statistics
- Decision 2367/2002/EC of 16 December 2002 on the Community statistical programme 2003 to 2007
- Regulation 295/2008 of 11 March 2008 concerning structural business statistics