Archive:Sustainable development - good governance
- Data from July 2011, most recent data: Further Eurostat information, Database.
This article provides an overview of statistical data on sustainable development in the area of good governance. They are based on the set of sustainable development indicators the European Union (EU) agreed upon for monitoring its Sustainable development strategy. Together with similar indicators for other areas, they make up the report 'Sustainable development in the European Union - 2011 monitoring report of the EU sustainable development strategy', which Eurostat draws up every two years to provide an objective statistical picture of progress towards the goals and objectives set by the EU sustainable development strategy and which underpins the European Commission’s report on its implementation. More detailed information on good governance indicators, such as indicator relevance, definitions, methodological notes, background and potential linkages, can be found on page 339-359 of abovementioned publication.
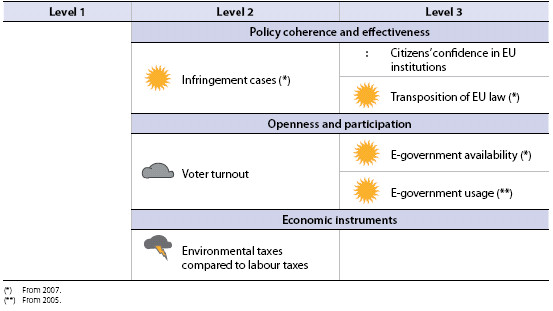
The table below summarises the state of affairs of in the area of good governance. Quantitative rules applied consistently across indicators, and visualised through weather symbols, provide a relative assessment of whether Europe is moving in the right direction, and at a sufficient pace, given the objectives and targets defined in the strategy.
Overview of main changes
The trends observed in the good governance theme since 2000 have been mixed. There have been favourable trends as regards infringement cases as well as e-government availability and usage. In addition, the transposition of EU law has been above the target rate. There have, however, been negative trends with regard to voter turnout in national parliamentary elections, which is generally falling. Moreover, trends in the ratio of environmental to labour taxes show that a general shift towards a higher share of environmental taxes in total tax revenues has not been achieved.
Main statistical findings
Policy coherence and effectiveness
Citizens' confidence in EU institutions
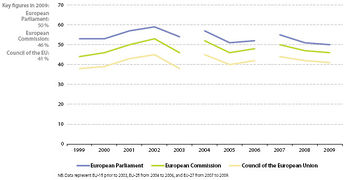
The European Parliament continues to be the most trusted among the main EU institutions, followed by the European Commission and the Council of the European Union. Trust levels for all three institutions in the EU have, however, dropped in 2009 compared to the levels in 2007
In 2009 half of the EU citizens who were interviewed said that they trusted the European Parliament, making it the most trusted of the three main EU institutions. Fewer citizens said that they trusted the European Commission (46 %) and the Council of the EU (41 %). Since 2007, however, trust levels for all three institutions have decreased in the EU as a whole. Trust in the European Parliament has declined by 9.1 %, in the Commission by 8 %, and in the Council by 6.8 %.
Confidence in the three main EU institutions has developed in parallel since 1999, with the level of trust in each institution remaining approximately the same over the entire period [1].
Infringement cases
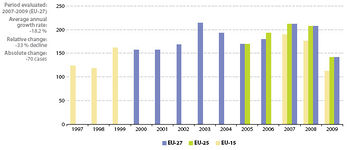
The number of new infringement cases in the EU decreased considerably between 2007 and 2009
- More than 50 % of new infringement cases in 2009 concerned Environment, Health and Consumer Protection and
Internal Market
There was a considerable decrease of new infringement cases in the EU between 2007 and 2009. Whereas cases decreased only slightly between 2007 and 2008 (from 212 to 207), the drop between 2008 and 2009 was substantial (from 207 to 142). This was mainly due to a reduction of new cases in two policy areas: Internal Market, which had an exceptionally high number of cases in 2008 (71 cases, compared to about 30 cases in 2007 and 2009), and Justice and Home Affairs, which showed a notably high number in 2007 (77 cases, compared to 38 in 2008 and 14 in 2009).
There are also considerable differences among the individual policy sectors. Environment, Health and Consumer protection (31.5 %) and Internal market (19.6 %) still made up more than half of all new infringement cases in 2009. Between 2008 and 2009 new infringement cases decreased in seven policy sectors, increased in two sectors and remained the same in another two sectors.
Transposition of EU law
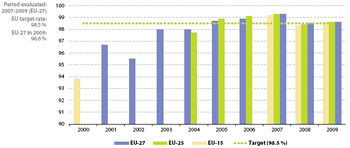
In each year from 2007 to 2009 the enactment of EU law into national law was above the target rate of 98.5%
- Transposition of Community law was slightly above target in 2009
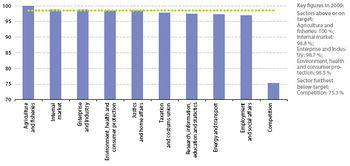
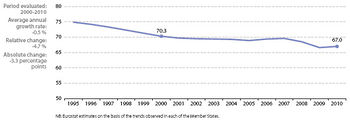
The indicator measures the percentage of EU directives that have been adequately enacted into national law. Almost all EU directives are connected to the Single Market. In 2001 the European Council set the target of 98.5 % rate of transposition of EU directives relating to the Single Market by national authorities. In 2009 the rate of transposition for all EU directives was slightly above target (at 98.6 %), but below the transposition level of 99.3 % seen in 2007.
- Four out of ten Single Market policy sectors were above or on target
All policy sectors in the Single Market in 2009 had reached transposition rates above 97 %, with the notable exception of ‘competition’ (75.3 %). Only four out of ten policy sectors were, however, either above or at the target level of 98.5 %.
Openness and participation
Voter turnout
Participation in national parliamentary elections in the EU decreased slightly between 2000 and 2010 However, the turnout has been generally higher than in EU elections
- Voter turnout in national parliamentary elections decreased
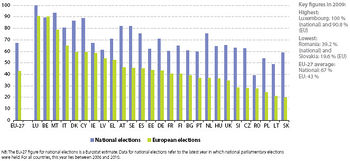
Between 2000 and 2010 voter turnout in the EU Member States in national parliamentary elections decreased slightly. Voter turnout in the individual Member States varies from 100 % to 39.2 %, mainly due to different national traditions and electoral systems, but has remained above 50 % in all but two countries.
- Participation in European Parliament elections has been poorer than in national elections
Participation in elections to the European Parliament has been substantially lower than in national elections. In 2009 voter turnout in the European Parliament elections stood at 43 %, somewhat lower than in the previous elections of 2004 (45.5 %) and 1999 (49.5 %). The poorer voting record of the European Parliament elections compared to the national parliaments – more than 20 % difference in 17 countries, with only one country showing the contrary result – may reflect a lack of information on EU matters among EU citizens [2] as well as the fact that EU elections may not be perceived by citizens as having a significant impact on national policies and personal interests.

E-government availability
Between 2007 and 2010 the availability of online public services steadily increased in the EU-27, reaching 84.3 % in 2010
- In 2010, 84.3% of the EU's public services were available online
Availability of e-government is widespread in the EU and has been steadily increasing, from 58.3 % in 2004 to 84.3 % in 2010.
The quantity of online services for citizens and businesses offered varies between Member States. In 2010, six countries, Austria, Ireland, Italy, Malta, Portugal, and Sweden had 100 % of basic public services fully available online. Twelve offered between 75 % and 99 %, eight offered between 50 % and 74 %. Only Greece, offered less than 50 %.
- 12 Member States offered more than 75% of basic public services online
The European Commission recently concluded that ‘Europe has continued to make progress in the delivery of online public services towards meeting the objectives of the Lisbon Agenda and the i2010 e-Government Action Plan … . However, this increase masks substantial differences between services for businesses and services for citizens: the former have almost reached saturation with 83 % availability while the latter, with 63 % availability, shows a significant shortfall’ [3]. Nevertheless, it should be pointed out that the basic public services applied for assessing progress of e-government in Europe [4] are administrative, procedural or informational in nature and do not include forms of direct exchange with policy-makers and/or decision-making mechanisms (e.g. e-voting).
E-government usage
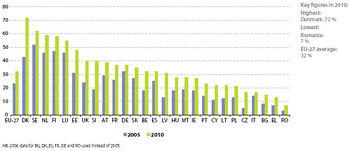
The use of online public services increased significantly in the EU between 2005 and to 2010. Overall, about one-third of EU citizens used e-government in 2010
- E-government usage is on the rise
- Usage in 2010 varied between 72 % and 7 % among Member States
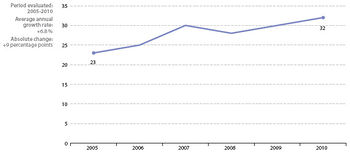
Between 2005 and 2010 the use of the internet for interaction between public authorities and citizens in the EU increased. In 2010 e-government usage was above 50 % in five countries (Denmark, Sweden, Netherlands, Finland and Luxembourg), whereas it varied between 48 % and 7 % in the remaining Member States. The degree of this variation is consistent with the picture presented by the previous indicator, e-government availability (see above). One reason for this difference lies in the varying degrees of internet coverage and general internet use in individual Member States. As stated in a recent Commission report, ‘the large disparity in e-government use seems to be driven more by the degree of internet penetration in a country than by the degree of sophistication of its online provision. There is a strong correlation across countries between internet use and the percentage of users that take up e-government services’ [5].
- E-government availability and usage are not directly related
There is, however, no direct connection between the offer of online public services and e-government usage. In 2010 84.3 % of the EU’s public services were available online, while e-government usage was only about 30 %. Only some countries such as Sweden, Finland and Denmark have reached high levels of both e-government availability and e-government usage.
Economic instruments
Environmental taxes compared to labour taxes
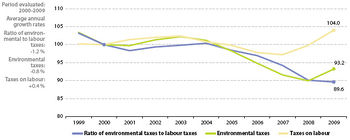
The ratio of environmental to labour taxes decreased in the EU from 2000 to 2009. This trend is counter to the goal of the EU Sustainable Development Strategy to shift taxation from labour into resource and energy consumption and/or pollution
- The ratio of environmental to labour taxes is shifting away from environmental taxes
The ratio of environmental to labour taxes decreased from 0.13 in 2000 to 0.12 in 2009. This indicates a decline in the share of environmental taxes in total tax revenues compared to labour taxes, in particular since 2004.
- The share of environmental taxes in total tax revenues is declining
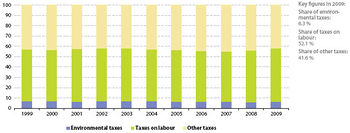
The share of environmental taxes in total tax revenues fluctuated between 2000 and 2009. When looking at the share of environmental taxes in the individual Member States, substantial differences between the Member States are revealed. In 2009 only three, Bulgaria, Denmark and Netherlands, showed a share above 10 % (highest 11.9 %) of total tax revenue. In order to understand the decline of environmental taxes as a share of total tax revenues, it is important to understand that environmental taxes are levied per unit of physical consumption (unit taxes) and are usually fixed in nominal terms. Hence, unlike ad valorem taxes [6], their real value in relation to GDP tends to fall unless they are adjusted for inflation or otherwise increased at regular intervals[7].
- There are large differences between Member States in the level of labour taxes
As with environmental taxes, the share of labour taxes in total revenues fluctuated between 2000 and 2009. The highest share was in 2009 (52.1 %) and the lowest in 2007 (48.7 %). Generally, the taxation on labour is much higher in the EU than in other major economies [8]. Nevertheless, there are large differences in the level of taxation among the Member States (ranging from 27.7 % to 60.5 %).
Further Eurostat information
Publications
Database
- Good governance (Theme 10)
- Policy, coherence and effectiveness
- Openness and participation
- Economic instruments
Dedicated section
Other information
- European governance - A White Paper, European Commission, COM/2001/ 428
- Commission report, Aarhus Convention Implementation Report, European Commission, SEC(2008) 556
- Commission communication, The European eGovernment Action Plan 2011-2015: Harnessing ICT to promote smart, sustainable & innovative Government, European commissioon, COM(2010) 743
- Commission communication, A Digital Agenda for Europe, European Commission, COM(2010) 245
- Commission staff working document, Europe’s Digital Competitiveness Report, vol. 1, European Commission, SEC(2010) 627
- European Commission, Taxation trends in the European Union: Data for the EU Member States, Iceland and Norway, 2011 edition, Luxembourg, Office for Official Publications of the European Union, 2011
External links
- European Commission - Sustainable Development - The renewed European Sustainable Development Strategy 2006
- OECD - Public Governance and Management
- United Nations - Global issues - Governance
See also
Notes
- ↑ European Commission, Eurobarometer 72, Brussels, 2010
- ↑ Farrell, D.M. and Scully, R. Representing Europe’s citizens? Electoral institutions and the failure of parliamentary representation, Oxford University Press, Oxford, 2007
- ↑ Commission staff working document, Europe’s Digital Competitiveness Report, vol. 1, SEC(2010) 627
- ↑ A basket of 20 public services are applied to assess progress of e-government in Europe. The list of these public services can be found in the methodological notes at the end of this chapter.
- ↑ Commission staff working document, Europe’s Digital Competitiveness Report, vol. 1, SEC(2010) 627
- ↑ Ad valorem taxes are taxes based on the assessed value of real estate or personal property
- ↑ Eurostat, Taxation trends in the European Union: Data for the EU Member States, Iceland and Norway, 2010 edition, Luxembourg, Office for Official Publications of the European Union, 2010
- ↑ Eurostat, Taxation trends in the European Union: Data for the EU Member States, Iceland and Norway, 2010 edition, Luxembourg, Office for Official Publications of the European Union, 2010
