Archive:Sustainable development - climate change and energy
- Data from July 2011, most recent data: Further Eurostat information, Database.
This article provides an overview of statistical data on sustainable development in the areas of climate change and energy. They are based on the set of sustainable development indicators the European Union agreed upon for monitoring its sustainable development strategy. Together with similar indicators for other areas, they make up the report 'Sustainable development in the European Union - 2011 monitoring report of the EU sustainable development strategy', which Eurostat draws up every two years to provide an objective statistical picture of progress towards the goals and objectives set by the EU sustainable development strategy and which underpins the European Commission’s report on its implementation. More detailed information on climate change and energy indicators, such as indicator relevance, definitions, methodological notes, background and potential linkages, can be found on page 215-246 of abovementioned publication. A synthetic overview of all indicators can be found here.
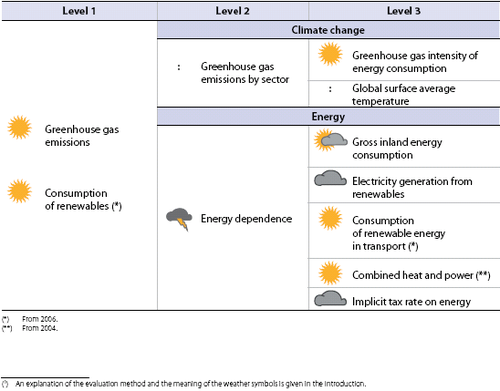
The table below summarizes the state of affairs of in the area of climate change and energy. Quantitative rules applied consistently across indicators, and visualized through weather symbols, provide a relative assessment of whether Europe is moving in the right direction, and at a sufficient pace, given the objectives and targets defined in the strategy.
Overview of main changes
For the majority of the climate change and energy indicators progress since 2000 has been good, particularly in the second half of the decade, while unfavourable trends continue for only a small number of indicators. Although the transformation to a low-carbon economy is already reflected in some indicators the economy of the EU remains energy- and carbon-intensive and most indicators in this theme are closely linked to economic growth. It is therefore to be expected that the economic crisis has had a considerable impact on the issues discussed in this chapter. On the whole, the changes in trends over 2008 and 2009 are not the result of profound, structural changes but rather a temporary interruption of longer term trends.
Main statistical findings
Headline indicators
Greenhouse gas emissions
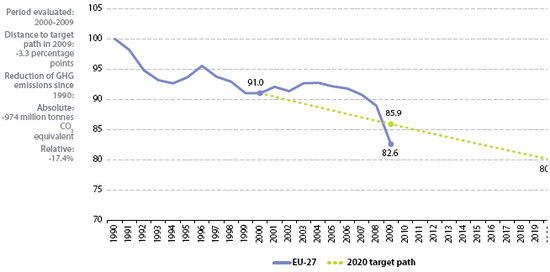
Between 2000 and 2009 EU-27 greenhouse gas emissions declined. This reduction puts the EU below the target path towards a reduction of 20 % below 1990 levels by 2020
Commentary
EU greenhouse gas emissions increased in the early 2000s, but started to decline after 2004 and are now below 2020 target path
The EU has set a mid-term target to reduce emissions by at least 20 % below 1990 levels by 2020. This 2020 target is evaluated here as the main headline target.
EU-27 greenhouse gas emissions were 17.4 % below 1990 levels in 2009 — a net reduction of 974 million tonnes of CO2 equivalent, 355 million tonnes of which were in 2009. Major reductions were achieved in the 1990s when emissions decreased at an annual average rate of 0.9 %. Emissions began to rise again in the first half of the 2000s, but this trend was reversed in 2004. Between 2004 and 2009, greenhouse gas emissions declined, on average, faster than during the 1990s.
The reductions achieved between 2000 and 2008 result from more efficient use of energy [1] and also reflect a switch to fuels with lower carbon content. Lower carbon intensity allowed emissions to fall despite rising energy consumption and transport volumes. Significant reductions were also achieved in the waste and agriculture sectors, which are responsible for the majority of non-CO2 greenhouse gas emissions such as methane and nitrous oxide [2]. An increase in renewable energy consumption and the economic recession are the main factors behind the stark reduction in greenhouse gas emissions in the EU in 2009 [3].
Emission reductions between 2000 and 2009 put the EU below the target path to the 2020 target. However, a large part of these reductions is due to the impacts of the economic crisis. International Energy Agency estimates of energy-related CO2 emissions indicate that emissions increased again in 2010 [4]. Furthermore, even with the average rate of decline between 2000 and 2009 the EU is not yet on track to meet its longterm commitment to reduce greenhouse gas emissions by 80-95 % by 2050 compared to 1990.
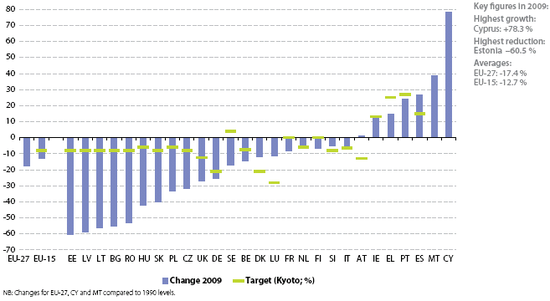
19 Member States have already reached their Kyoto targets. Between the Kyoto base year and 2009, GHG emissions in the EU-15 fell by roughly 12.7 %. Over this period, Spain recorded the highest increase in its GHG emissions (27%), followed by Portugal (24 %), Greece (14 %) and Ireland (12 %). In contrast, significant decreases were observed in Estonia (‑60 %), Latvia (‑58 %), Lithuania (‑56 %), Bulgaria (‑55 %) and Romania (‑53 %).
In 2009, among the largest emitters, Germany (20 % share of total EU-27 emissions), the United Kingdom (12 %) and France (11 %) decreased their emissions by 25 %, 27 % and 10 % respectively compared to the base year; while Italy (11 % of the total) increased them by 5 %. Without exception emissions decreased in all EU Member States from 2008 to 2009. This was partly due to the impact of the economic crisis, which strongly affected energy-intensive sectors, such as steel or cement production.
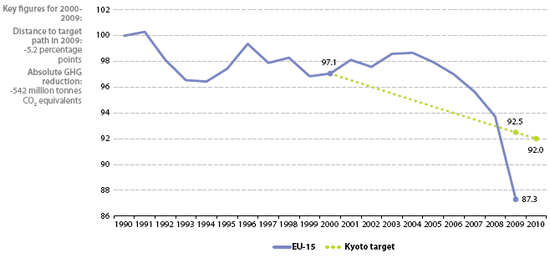
EU-15 on track to meet collective Kyoto target
Between 1990 and 2009, EU-15 greenhouse gas emissions declined by 12.7 %, putting the group well on track towards the 8 % reduction target for 2008-2012 set in the Kyoto Protocol. Emissions rose somewhat in the first years of the century, but have shown a clear downward trend since 2004. The decline was sharp between 2008 and 2009.
Consumption of renewables
Between 2006 and 2008 the share of renewables in gross final energy consumption grew steadily. If growth were to be sustained at the rate observed over this short period, the EU would meet its 2020 target
Growth in renewables in energy consumption is on track to exceeding the 20 % target by 2020
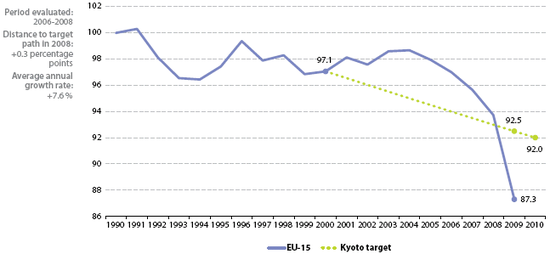
In 2008, the share of renewables in gross final energy consumption reached 10.3 %, up from 8.9 % in 2006. This represents an average annual increase of 7.6 % per year between 2006 and 2008. Available data only covers a three-year-period which makes extrapolation difficult. However, if this pace of growth could be sustained, the EU would exceed its target of covering 20 % of final energy consumption from renewable sources by 2020.
The share of energy from renewable sources is highest in electricity generation where renewables covered 16.7 % of gross consumption in 2008. In final energy consumption for heating, the share of renewables stood at 11.9 % while it reached only 3.5 % in fuel consumption for transport [5].
Increased uptake of renewables reflects incentives
The increase in the share of renewables is driven by two main trends. Installed capacity for renewable electricity and heat generation has been growing steadily since 1990, as has the use of biofuels between 2004 and 2008. This growth is in major parts a result of promotion policies, including feed-in tariffs, grants, tax credits and quota systems. Moreover, total gross final energy consumption was lower in 2008 compared with 2006, thereby increasing the relative contribution of renewable energy[6]. Measures such as energy savings and improving energy efficiency are expected to further reduce energy consumption and influence the average annual growth rate of renewables.
Member State measures to increase use of renewables are documented in Action Plans
In the national renewable energy action plans Member States explain how they plan to reach the targets set in the Renewable Energy Directive [7]. If all Member States follow the trajectories for renewable energy expansion outlined in their plans, the EU should exceed its 20 % target by 0.7 percentage points [8].
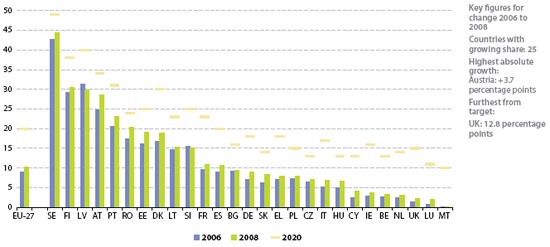
The share of renewables in energy consumption in 2008 varied from 0.2 % to 44.4 % between Member States
The share of renewable energy sources in gross final energy consumption for 2008 varied widely among Member States ranging from 0.2 % in Malta to 44.4 % in Sweden. This range reflects differences in the respective resource base, mainly with regard to hydropower capacity and biomass availability. Between 2006 and 2008, all but two Member States increased their share of renewable energy, albeit by differing amounts.
Climate change
Greenhouse gas emissions by sector
The energy industries and the transport sector are the biggest greenhouse gas emitters in the EU
Whilst the share of emissions from manufacturing and construction and industrial processes have fallen, the share of emissions from transport has increased
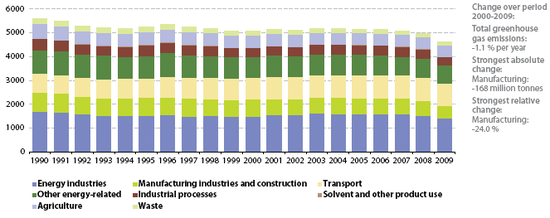
With some notable exceptions, the proportions of total GHG emissions (excluding international bunkers and land use, land use change and forestry) emitted by each of the main source categories in the EU‑27 have changed very little between 1990 and 2009. The main changes have been reductions from manufacturing industries and construction (from 14.8 % to 11.5 %) and from industrial processes (from 8.3 % to 7 %) as well as, most notably, an increase from 13.8 % to 20.2 % from transport. Changes in the shares emitted by other categories have been minor.
The vast majority (77.5 %) of EU-27 GHG emissions come from energy combustion in industry, transport and other sectors. A further 1.8 % are fugitive emissions resulting mainly from leakage and vapour loss. Together, combustion and fugitive emissions comprise the energy sector, and the trends in the emissions from this sector reflect both the quantities of energy and the mix of fuels consumed. Changes in the energy consumption of the different sectors are monitored by the indicator ‘final energy consumption’ in the chapter on sustainable consumption and production, whilst changes in the overall fuel mix are monitored by the indicator ‘gross inland energy consumption’ in this chapter. It is of note that whilst emissions from the energy sector fell by 1.3 % between 2000 and 2008, gross inland energy consumption grew by 4.5 %.
In the energy sector the energy industries dominate the picture both in terms of their energy consumption and in terms of emissions. They are followed by transport, and manufacturing and construction. Measured in absolute terms, the decline was strongest in the manufacturing and construction sector, which was responsible for 11.5 % of total emissions in 2009. Greenhouse gases emitted by the energy industries in the EU fell by -0.7 % per year on average between 2000 and 2009. Over the same period, greenhouse gas emissions from transport grew by 0.2 % per year. While emissions from both sectors had grown until 2007, they both fell in 2008 and 2009.
The second largest emitting sector is agriculture, which accounted for 10.3 % of total emissions in 2009. Nevertheless, emissions from this source have been steadily declining, being 7.5 %% less in 2009 than in 2000 and 22 % less than in 1990. The decreasing number of livestock and use of less nitrogenous fertilizers are among reasons for this decline.
Emissions resulting from industrial processes, (7.0 % of total emission in 2009) remained rather stable between 2000 and 2008 but then dropped sharply in 2009. Emissions from non-energy related industrial processes are mainly CO2 from cement production, iron and steel production, nitrous oxide from nitric acid production, and hydrofluorocarbons from refrigeration and air conditioning equipment.
Measured in relative terms, there were substantial reductions in the waste sector, where emissions in 2009 were 19.4% below their level in 2000. However, because waste sector emissions represented only 3.2 % of total emissions in 2009, the absolute reduction of 35 million tonnes is dwarfed by reductions in other sectors, in particular the 325 million tonne reduction in emissions from the energy sector.
Despite recent downturn, international bunkers remain fastest growing source of GHG emissions
For the first time since 1991, emissions from international bunkers decreased slightly in 2008, and then fell substantially in 2009 as a consequence of the economic downturn. Nonetheless, emissions from international aviation and maritime transport remain the fastest growing source of greenhouse gas emissions. Compared with 1990 levels, total emissions from international bunkers are up by some 63 %. Emissions from international bunkers are excluded from the Kyoto Protocol and are currently not included in the reduction targets for 2012 and 2020. However, if added to total EU greenhouse gas emissions, international bunkers would raise the share of transport emissions in 2009 from 20.2 % to 25 %.
Patterns of land use, land use change and forestry practices (LULUCF) can contribute to emission reductions in two ways: removing greenhouse gases from the atmosphere (for example by planting trees or improving forest management) or reducing emissions resulting from these practices (for example by curbing deforestation).
Greenhouse gas intensity of energy consumption
Between 2000 and 2009 absolute decoupling of EU greenhouse gas emissions from gross inland energy consumption took place
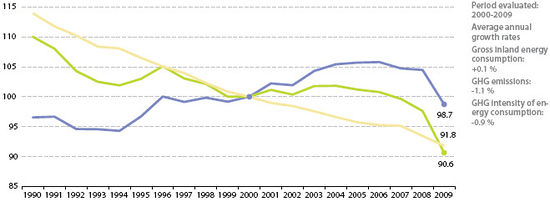
The EU emitted less GHG emissions per energy unit consumed
The greenhouse gas intensity of energy consumption in the EU steadily decreased between 2000 and 2009, mainly due to the switch from solid fuels to gas and, to a lesser extent, renewable energies [9]. Emissions intensity fell by 1.6 % between 2008 and 2009, which is faster than seen in the previous years of the decade. However, the average decrease in the 2000s is still slower than in the 1990s, when the emission intensity of energy consumption fell at an average annual rate of 1.1 %.
Global surface average temperature
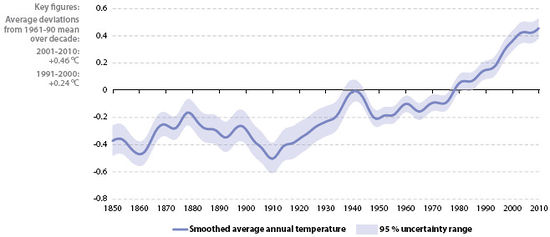
The years, 2010, 2005 and 1998 ranked as the warmest on record. The decade 2001–2010 was also the warmest ever recorded
2001–2010 was the warmest ten-year period ever recorded
According to the World Meteorological Organization (WMO), the year 2010, 2005 and 1995 rank as the warmest years on record since systematic instrumental measurements began around 1850. In 2010 the average global surface temperature climbed to 0.53 °C above the 1961–1990 average of 14 °C. Warming has been particularly strong in Africa, parts of Asia, and parts of the Arctic. Between 2001 and 2010, the average global surface temperature was 0.46 °C above the 1961-1990 mean, making the decade the warmest ten-year period ever recorded [10]. This follows the trend in temperature where the 2000s were warmer than the 1990s, which were warmer than the 1980s and earlier decades.
According to WMO, ‘the 2010 data confirm the Earth’s significant long-term warming trend’. Since the beginning of the 20th century, the global average surface temperature has risen by 0.74 °C. However, the rate of increase was not continuous, but accelerated over the second half of the century [11]. The temperature rise is also unequal across space. Warming is much stronger over land than over the ocean and, as a consequence, the temperature rise is higher over the northern hemisphere (where most of the Earth’s land area is located) than over the southern hemisphere [12].
Energy
Energy dependence
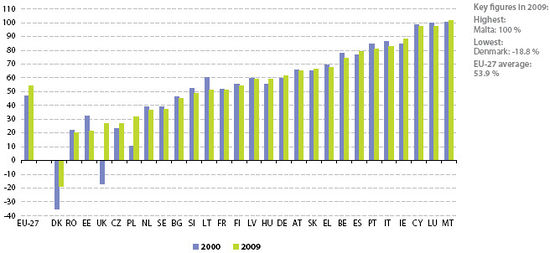
The EU dependence on energy imports increased substantially from 2000 and reached 53.9 % in 2009. It is now substantially higher than during the 1990s
The EU depends on foreign imports for more than half of the energy it consumes
Energy dependence shows how much an economy relies on imports to meet its domestic energy demand. Between 2000 and 2009, EU dependence on energy imports grew from 46.8 % to 53.9 %. Compared with the previous decade, when imported energy remained fairly constant at about 45 %.
Overall energy dependence can be broken down by different energy sources. In 2009 dependence was highest for crude oil with an import share of 83.5 %, followed by natural gas (64 %) and hard coal (62 %). Compared with 2000, dependence increased for all three sources. By contrast, the difference between imports and exports is close to zero for other energy sources, encompassing for example renewable energy, lignite, coke, patent fuels and brown coal briquettes. This category also includes nuclear energy, which is counted as a domestic energy source. These other sources together represent 27.3 % of gross inland energy consumption.
The main reasons for the increase in energy dependence are greater domestic energy demand, the increasing importance of natural gas imports, and declining North Sea oil and gas production.

Energy dependence was above 50 % in 17 EU Member States in 2009
In 2009, 17 out of the 27 EU Member States showed dependence rates over 50 %. Dependence was close to 100 % in the small countries Cyprus, Luxembourg and Malta. Eight Member States, mainly from northern and eastern Europe, had energy dependence levels well below 50 %. The lower import share reflects the larger availability of indigenous energy sources in these countries, ranging from coal (Poland, Czech Republic and Romania) to oil and gas (Denmark, UK and Netherlands) and renewable resources like biomass and hydro power (Sweden, Estonia).
Gross inland energy consumption
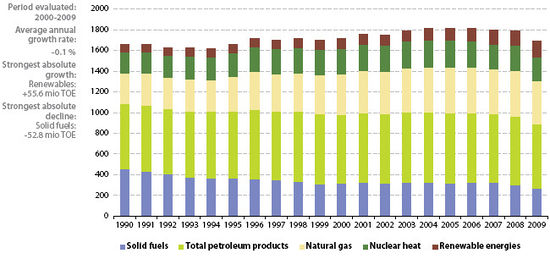
By 2009 compared to 2000 demand for energy in EU-27 decreased slightly. There has been a general shift away from solid fuels towards natural gas and to renewable energy
Lack of significant energy savings
2009 is the first year in the period that the EU used less energy than in 2000. This 1.2% decrease is likely due to the economic crisis. Even if quantitative target was not defined for this indicator, gross inland energy consumption (GIC) should be cut to a much larger degree if the EU is to meet its saving targets for energy use [13].
In comparison with the 1990s, small changes in the fuel mix have occurred since 2000. After plummeting from 27 % to 18.5 % in the previous decade, the share of solid fuels in total consumption fell to 15.7 % in 2009. The share of crude oil and petroleum products also decreased slightly from 38 % to 36.5 % between 2000 and 2009. Natural gas consumption, on the other hand, increased from 23 % to 24.5 %, and renewables consumption went up from 6 % to almost 9 % during the same period. Nuclear energy was the only energy source that experienced a trend reversal: after growing from 12 % to 14 % in the 1990s, consumption fell slightly to 13.5 % in 2009.
In absolute numbers, energy demand fell by 22 million tonnes of oil equivalent (TOE) between 2000 and 2009. Looking closer, energy demand increased by 77 million TOE from 2000 and 2008 and then sharply dropped by 99 million TOE to 2009. As consumption of fossil fuels, crude oil and nuclear energy fell, the rise in energy demand was met with an increase in natural gas and renewable energy consumption.
Electricity generation from renewables
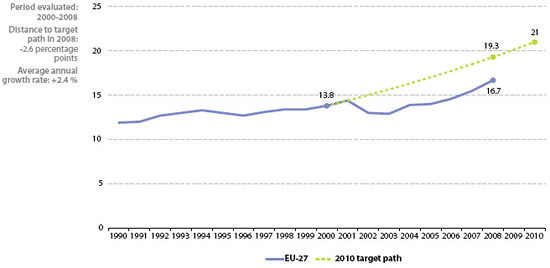
The share of renewables in electricity production in the EU increased between 2000 and 2008. Nonetheless, growth remains too slow to reach the 2010 target
In 2008 one sixth of EU electricity was produced from renewable energy sources
Between 2000 and 2008 the share of renewable energy sources in electricity generation in the EU grew quickly, reaching 16.7 % in 2008. After declining early in the decade, the share of renewables increased by an average annual rate of 6.1 % between 2005 and 2008, four times faster than during the 1990s. However, even at this growth rate the EU would not meet its target to cover 21 % of electricity consumed from renewable sources by 2010. To date, only Hungary and Germany have already met their national targets for 2010 and only 5-10 other Member States are likely to meet theirs, based on existing 2006-2008 data.
In 2008, hydro power delivered the largest share of total renewable electricity (60 %), followed by wind energy (21 %) and biomass (17 %). Small contributions came from geothermal energy (1 %) and solar energy (1 %). However, the increase in renewable production in the 2000s was mainly due to installations of additional wind turbines and solar energy systems [14].
Member States make progress in removing barriers to renewable energy production
In the past, growth in the renewable energies sector was hampered by high prices and administrative difficulties, and significant hurdles remain in several Member States [15]. Nonetheless, recent installation rates show that most Member States are increasingly successful in addressing these barriers. Instruments for promoting electricity generation from renewable sources include financial support for example through feed-in tariffs, quota systems or grants, but also improvements in the regulatory framework to ensure priority access to the grid and swift authorisation procedures. Detailed information on existing and planned measures can be found in the National Renewable Energy Action Plans which detail how Member States plan to reach the Renewable Energy Directive’s targets [16].
Consumption of renewable energy in transport
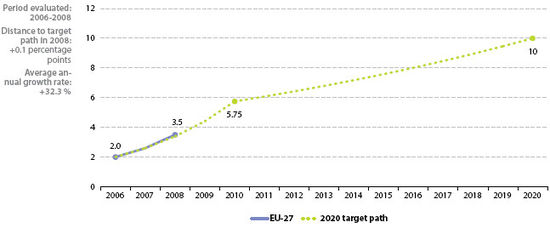
Growth in the EU consumption of renewable energy in transport accelerated between 2006 and 2008. At the current pace, the 2010 target is likely to be met
The EU will likely meet the 2010 target for renewable energy used in transport
From 2006 to 2008 the EU share of renewable energy in the petrol and diesel consumption of transport increased from 2 % to 3.5 %.The share of renewable energy in transport in 2008 remained below the 2010 target of 5.75 %. Nonetheless, at the average annual growth rate between 2006 and 2008, the EU would be able to reach both the 2010 target and the binding 10 % target by 2020.
The increase in renewable energy consumption, mainly based on the use of biofuels, reflects the widespread introduction of support systems at national level. Member States use tax rebates or biofuel obligations to promote renewable energy consumption in road transport [17]. Governments have also set national targets as required by the Directive on renewable energy in transport [18] some of which are above the minimum 10 % target [19]
Combined heat and power
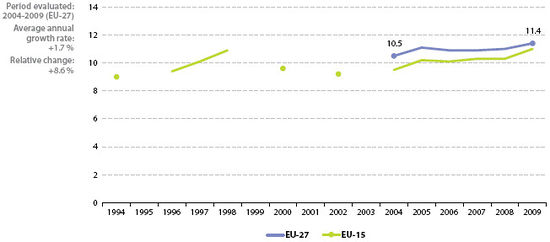
Between 2004 and 2009 the share of combined heat and power in gross electricity generation in the EU grew steadily, reaching 11.4 %
Combined heat and power generation grows at a slow pace
Between 2004 and 2009, the share of combined heat and power (CHP) in total EU electricity generation rose from 10.5 % to 11.4 %. Although a longer time series for the EU-15 is also shown in the figure below, these data should be treated with caution due to changes in the calculation method over time.
According to the Energy Efficiency Action Plan of 2006, several barriers, such as the lack of widespread district heating networks and, in some cases, lack of economic competitiveness, prevent capacity expansion [20]. In its 2011 Energy Efficiency Action Plan, the Commission therefore proposes to make authorisation for new thermal power generation conditional on use of CHP if there is a sufficient potential demand for the heat produced [21]
Implicit tax rate on energy
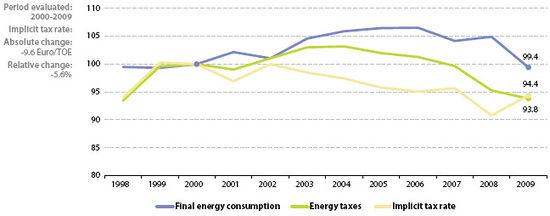
The implicit tax rate (ITR) on energy fell between 2000 and 2009
Between 2000 and 2009, the implicit tax rate has fallen
The ratio of energy tax revenues to final energy consumption represents the effective tax burden on energy. There was a predominantly downward trend at EU-27 average level between 2000 and 2009 and the implicit tax rate fell by 5.6 %. The decrease indicates a decline in the effective tax burden on energy relative to the potentially taxable base. This trend conflicts with the EU Sustainable Development Strategy’s principle of shifting taxation from labour onto resource and energy consumption. It is noteworthy; however that in 18 Member States the ITR was almost constantly growing over the period.
The progress and initial values are very different at Member States level. In the period 2000-2009 the average ITR varied from 28.8 Euro per tons of oil equivalent (TOE) in Romania to 291.4 TOE in Denmark. By and large, in most countries where the ITR was low in 2000 there has been an increase both in absolute and relative terms in the period till 2009. Also generally true, that ITR decreased, but only moderately, in those Member States where its initial value was higher. The exception is Romania where ITR was 58.2 Euro/TOE in 2000 and by 2009 it decreased to the lowest value in the EU to 26.6 Euro/TOE.
Furthermore, the share of energy taxes in total tax revenues also declined over this period. Even when Final Energy Consumption [22] increased fastest, between 2000 and 2004 (by 1.4 % per year), the share remained almost stable.
Since most energy taxes are levied as a nominal amount per unit of consumption, inflation leads to a reduction of the tax burden in real terms if the taxes are not adjusted on a regular basis.
Further Eurostat information
Publications
- Driving forces behind EU-27 greenhouse gas emissions over the decade 1999-2008 - Statistics in focus 10/2011
- Energy, transport and environment indicators - Pocketbook, 2011
- Sustainable development in the European Union - 2011 monitoring report of the EU sustainable development strategy
Database
- Indicators
- Climate Change and Energy
Dedicated section
Other information
- Commission communication, Analysis of options to move beyond 20% greenhouse gas emission reductions and assessing the risk of carbon leakage, COM(2010) 265
- Commission communication, A roadmap for moving to a competitive low carbon economy in 2050, COM(2011) 112
- Commission communication ,White paper - Adapting to climate change : towards a European framework for action, European Commission, COM/2009/0147 final
- European Enviroment Agency Annual European Union greenhouse gas inventory 1990-2009 and inventory report 2011, Publications Office of the European Union, Luxembourg, 2011
- Fee, E. (ed.), Johansson, D., Lowe, J., Marbaix, P., Matthews, B., and Meinshausen, M. Scientific Perspectives after Copenhagen, Belgian Presidency of the Council of the EU, 2010
- International Energy Agency, World Energy Outlook 2010 Paris, IEA, 2010
- Pachauri, R.K and Reisinger, A. (eds.), Climate Change 2007: Synthesis Report, Geneva, Intergovernmental Panel on Climate Change, 2007
- Richardon, K., et al., Climate change: Global Risks, Challenges and Decisions, Synthesis Report from the Scientific Congress in Copenhagen, Copenhagen, 2009
- Rummukainen, M. and Källén, E., New climate science 2006-2009, The Commission on Sustainable Development, Stockholm, 2009
External links
See also
- All articles on sustainable development indicators
- Climate change statistics
- Energy production and imports
Notes
- ↑ See the indicator ‘energy intensity’ in the ‘socioeconomic development’ chapter
- ↑ See the indicator ‘greenhouse gas emissions by sector’ in this chapter.
- ↑ European Environment Agency, European Union greenhouse gas inventory 1990–2009 and inventory report 2011, Publications Office of the European Union, Luxembourg, 2011.
- ↑ International Energy Agency, Prospect of limiting the global increase in temperature to 2ºC is getting bleakerLatest information, 30 May 2011
- ↑ Roubanis, N., Dahlström, C., Noizette, P., Eurostat Renewable Energy Statistics, Statistics in Focus 56/2010 Luxembourg, 2010; see also the indicator ‘gross inland energy consumption’ in this chapter
- ↑ ibid.
- ↑ European Commission Transparency Platform, National Renewable Energy Action Plans
- ↑ Beurskens, L.W.M., Hekkenberg, M., Renewable Energy Projections as Published in the National Renewable Energy Action Plans of the European Member States Amsterdam, Energy Research Centre of the Netherlands, 2011
- ↑ See the indicator 'gross inland energy consumption'
- ↑ World Meteorological Organization, 2010 equals record for world’s warmest year, Geneva, WMO Press release No. 906, 20 January 2011.
- ↑ World Meteorological Organization, WMO statement on the status of the global climate in 2008, Geneva, WMO-No 1039, 2009
- ↑ Pachauri, R.K. and Reisinger, A. (eds), Climate Change 2007: Synthesis Report, Geneva, Intergovernmental Panel on Climate Change, 2007
- ↑ COM(2010) 639, op. cit.
- ↑ Roubanis, N., Dahlström, C., Noizette, P., Eurostat, Renewable Energy Statistics, Statistics in Focus 56/2010, Luxembourg, 2010.
- ↑ Commission Staff Working Document,Recent progress in developing renewable energy sources and technical evaluation of the use of biofuels and other renewable fuels in transport, SEC(2011) 130
- ↑ European Commission, Transparency Platform,National Renewable Energy Action Plans
- ↑ Commission Staff Working Document, Recent progress in developing renewable energy sources and technical evaluation of the use of biofuels and other renewable fuels in transport, SEC(2011) 130.
- ↑ Directive 2003/30/EC on the promotion of the use of biofuels or other renewable fuels for transport,
- ↑ Geeraerts, K. et. al. National Legislation and national initiatives and programmes (since 2005) on topics related to climate change European Parliament’s Temporary Committee on Climate Change. 2007, p. 41.
- ↑ Commission communication, Action plan for energy efficiency: Realising the potential, COM(2006) 545
- ↑ Commission communication, Energy Efficiency Plan 2011 COM(2011) 109, pp. 8-9.
- ↑ See indicator ‘final energy consumption’ in the chapter on ‘sustainable consumption and production’
