Archive:Sustainable development - climate change and energy
- Data from July 2011, most recent data: Further Eurostat information, Database.
This article provides an overview of statistical data on sustainable development in the areas of climate change and energy. They are based on the set of sustainable development indicators the European Union agreed upon for monitoring its sustainable development strategy. Together with similar indicators for other areas, they make up the report 'Sustainable development in the European Union - 2011 monitoring report of the EU sustainable development strategy', which Eurostat draws up every two years to provide an objective statistical picture of progress towards the goals and objectives set by the EU sustainable development strategy and which underpins the European Commission’s report on its implementation. More detailed information on climate change and energy indicators, such as indicator relevance, definitions, methodological notes, background and potential linkages, can be found on page 215-246 of abovementioned publication. A synthetic overview of all indicators can be found here.
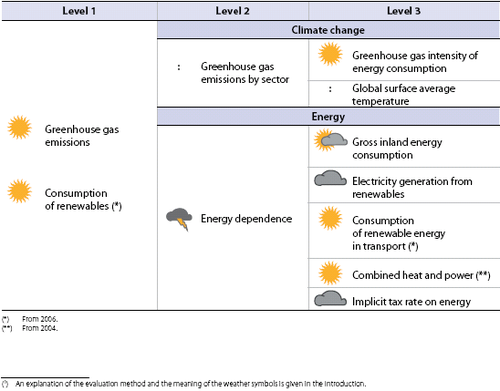
The table below summarizes the state of affairs of in the area of climate change and energy. Quantitative rules applied consistently across indicators, and visualized through weather symbols, provide a relative assessment of whether Europe is moving in the right direction, and at a sufficient pace, given the objectives and targets defined in the strategy.
Overview of main changes
For the majority of the climate change and energy indicators progress since 2000 has been good, particularly in the second half of the decade, while unfavourable trends continue for only a small number of indicators. Although the transformation to a low-carbon economy is already reflected in some indicators the economy of the EU remains energy- and carbon-intensive and most indicators in this theme are closely linked to economic growth. It is therefore to be expected that the economic crisis has had a considerable impact on the issues discussed in this chapter. On the whole, the changes in trends over 2008 and 2009 are not the result of profound, structural changes but rather a temporary interruption of longer term trends.
Main statistical findings
Headline indicators
Greenhouse gas emissions
Between 2000 and 2009 EU-27 greenhouse gas emissions declined. This reduction puts the EU below the target path towards a reduction of 20 % below 1990 levels by 2020
Commentary
EU greenhouse gas emissions increased in the early 2000s, but started to decline after 2004 and are now below 2020 target path
The EU has set a mid-term target to reduce emissions by at least 20 % below 1990 levels by 2020. This 2020 target is evaluated here as the main headline target.
EU-27 greenhouse gas emissions were 17.4 % below 1990 levels in 2009 — a net reduction of 974 million tonnes of CO2 equivalent, 355 million tonnes of which were in 2009. Major reductions were achieved in the 1990s when emissions decreased at an annual average rate of 0.9 %. Emissions began to rise again in the first half of the 2000s, but this trend was reversed in 2004. Between 2004 and 2009, greenhouse gas emissions declined, on average, faster than during the 1990s.
The reductions achieved between 2000 and 2008 result from more efficient use of energy [1] and also reflect a switch to fuels with lower carbon content. Lower carbon intensity allowed emissions to fall despite rising energy consumption and transport volumes. Significant reductions were also achieved in the waste and agriculture sectors, which are responsible for the majority of non-CO2 greenhouse gas emissions such as methane and nitrous oxide [2]. An increase in renewable energy consumption and the economic recession are the main factors behind the stark reduction in greenhouse gas emissions in the EU in 2009 [3].
Emission reductions between 2000 and 2009 put the EU below the target path to the 2020 target. However, a large part of these reductions is due to the impacts of the economic crisis. International Energy Agency estimates of energy-related CO2 emissions indicate that emissions increased again in 2010 [4].
(10). Furthermore, even with the average rate of decline between 2000 and 2009 the EU is not yet on track to meet its longterm commitment to reduce greenhouse gas emissions by 80-95 % by 2050 compared to 1990.
[5].
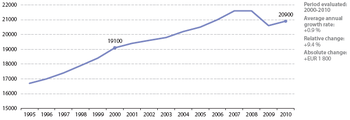
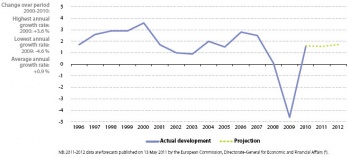
Financial crisis has hit particularly fast-growing eastern European Member States
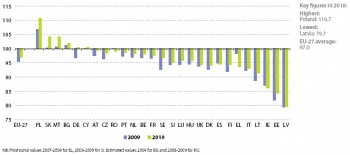
Some countries were hit harder by the economic crisis than others. A large slump in per capita GDP occurred especially in high-growth countries dependent on exports (mostly eastern European Member States whose economic output is expected to ‘catch up’ with that of the more developed Member States). GDP contraction in most western European Members States extended over four or five quarters before growth resumed. The picture has been more varied in eastern European Member States. Particularly affected by the crisis in terms of GDP per capita were Latvia (with the previous GDP per capita growth rate between 2000 and 2007 being 9.4 % on average), Estonia (8.8 %), Ireland (4.1 %), Lithuania (8.1 %) and Finland (3.2 %). However, some eastern European countries (in particular Poland, Bulgaria, Slovakia and Romania) were hit less severely, due in part to lower current account deficits and external debts at the start of the crisis, stricter banking policies, lower dependence on stock exchange performance and exports, more stable domestic demand and modest exchange rate depreciation (in Member States outside the Euro area). A moderate recovery began in 2010 for most EU countries, with the exception of Greece, Ireland, Latvia, Romania and Spain.
GDP per capita varies widely across the EU
In 2009, GDP per capita in the EU still varied widely between Member States. Among the countries with GDP per capita, in terms of purchasing power standards (PPS)[6]. higher than the EU average are Luxembourg (by 171 %)[7], Ireland (by 27 %), Netherlands (by 31 %), Austria (by 24 %), Denmark (by 21 %) and Sweden (by 18 %). The countries with the lowest are Bulgaria (lower than the EU average by 56 %, Romania (by 54 %), Latvia (by 48 %) and Lithuania (by 45 %) [8].
Consumption of renewables
From 2000 to 2007, the share of renewable sources in energy consumption in the EU-27 did not grow in line with the target path
Consumption of renewables has grown over the last decade but the share remains far from the target
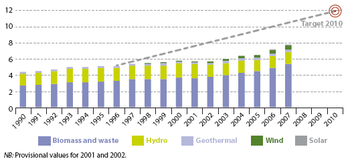
During the 1990s the consumption of renewable energies in the EU-27 increased significantly and has continued to grow between 2000 and 2007. Th is resulted in a share of 7.8 % in 2007 which remains, however, substantially below the 12 % target for 2010. Even if the highest annual change of 8.3 % between 2006 and 2007 continued, the share of renewables would remain below the target.
Biomass is by far the most important renewable energy source, delivering almost 70 % of the total renewable energy in 2007 and having the fastest growing share. Hydropower is second in importance even though both its share and its absolute contribution have diminished between 2000 and 2007 due to a series of several very dry years. Wind and geothermal energy are still minor contributors and, although their absolute growth rates are increasing rapidly, their shares are only growing slowly.
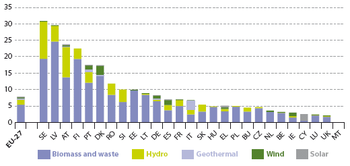
The proportion of renewables in gross inland energy consumption in 2007 varied widely between Member States. It ranged from 2.1 % in the UK to 29.7 % in Latvia and 30.9 % in Sweden, reflecting differences in resource base, mainly in respect to hydropower capacity and availability of biomass.
Biomass is the predominant renewable source, across all Member States, representing 5.4 % of EU-27 consumption in 2007. It provides 24.6 % of the gross inland energy consumption in Latvia, 19.3 % in Finland and 19.4 % in Sweden. Most of this is wood. In six Member States more than 90 % of renewable energy is derived from biomass. It is also the fastest growing share amongst renewable sources, due to the fact that biomass can be used in all three end-use sectors: power generation, transport and heating.
Second in overall importance is hydropower, which, however, not only decreased its share from 1.8 % to 1.5 % over the period 2000 to 2007 due to several very dry years, but also decreased in absolute terms. Wind and geothermal energy, whose shares have been growing at a very modest pace, are still relatively minor sources, together representing only 0.8 % of EU-27 energy consumption in 2007. In absolute terms, however, wind power capacity has been growing rapidly. It is now a significant renewable energy source in Spain, Denmark and Germany, where it makes up 22 %, 17 % and 12 % of renewables, respectively. Geothermal, generally another minor source, is the most important renewable energy source in Italy, where it represented 39 % of renewable energy in 2007. Solar energy remains the least important of all renewable energies in terms of its contribution. It represents 0.1 % of EU-27 gross inland energy consumption and 1.2 % of renewables, but its growth in absolute terms is impressive and solar energy constitutes an important renewable energy source in Cyprus and, to a lesser extent, in Greece with shares of 83 % and 10 % of total renewable energy.
Measures aimed at reducing the growth in gross inland energy consumption, for example through energy savings and improving energy efficiency, will also influence the growth rate of this indicator.
Climate change
Greenhouse gas emissions by sector
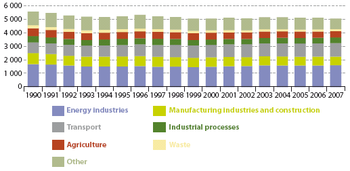
Greenhouse gas emissions decreased in most source categories between 2000 and 2007, but energy industries and transport, the two biggest emitting categories, increased their emissions, thereby offsetting some of the reductions achieved elsewhere
Greenhouse gas emissions from energy industries and transport offset much of the emissions decreases achieved by other sectors
Energy-related emissions represented approximately 80 % – by far the largest share – of total emissions in 2007. The largest emitting source category was the energy industries, which accounted for about 40 % of energy-related emissions, followed by transport, accounting for a further 24 % of energy-related emissions.
Between 2000 and 2007, greenhouse gas emissions produced by energy industries increased by 7.5 % in the EU-27 while energy consumption increased by 8.3 % over the same period. Greenhouse gas emissions from transport, which represented about one-fifth of all EU-27 greenhouse gas emissions in 2007, increased by 7 % in the same period. These two source categories have offset some of the emission decreases achieved elsewhere.
EU-27 emissions from industrial processes have been growing, but remained about 13 % below the 1990 level in 2006
Greenhouse gas emissions from industrial processes (CO2, nitrous oxide and fluorinated gases) in the EU-27 grew slightly between 2000 and 2007, although the 2007 level was still 9.9 % below that of 1990. Emissions from non-energy-related industrial processes are mainly CO2 from cement production, iron and steel production, nitrous oxide from nitric acid production, and hydrofluorocarbons from refrigeration and air conditioning equipment.
Other sectors saw decreases. Agricultural emissions fell by 5.7 %. Emissions in the manufacturing industry and construction dropped by 3.5 %.
Emissions from international bunkers account for a relatively small but rapidly growing proportion of greenhouse gas emissions. EU-27 greenhouse gas emissions from international aviation and maritime transport have increased by 109.7 % and 60.2 %, respectively, between 1990 and 2007.
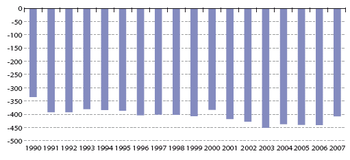
Patterns of land use, land-use change and practices in the forestry sector can offset emissions, either by removing greenhouse gases from the atmosphere (e.g. by planting trees or improving forest management) or by reducing emissions (e.g. by curbing deforestation). On average 425 million tonnes of CO2 were removed annually between 2000 and 2007 in the EU-27, which is rather higher than was achieved over the previous decade.
Greenhouse gas intensity of energy consumption
Between 2000 and 2007 moderate progress was made in reducing the greenhouse gas emissions per unit of energy consumption
The greenhouse gas intensity of energy consumption fell at a slower rate than during the 1990s

In the EU-27, the greenhouse gas intensity of energy consumption decreased by an average annual rate of about 0.6 % between 2000 and 2007, mainly due to the switching from solid fuels to gas and, to a lesser extent, to nuclear energy and renewable energies (see also indicator ‘Gross inland energy consumption’). However, the decrease was not as strong as in the 1990s when the emission intensity of energy consumption decreased by an annual average of 1.1 %.
Global surface average temperature
The global average temperature in 2008 was 0.7 °C higher than a century and a half ago
The global surface average temperature increased by 0.7 °C over the last century
The year 2008 was among the ten warmest on record since systematic instrumental measurements began in around 1850, although slightly cooler than previous years of this century.
According to the World Meteorological Organization statement on the status of the global climate in 2008, ‘since the beginning of the twentieth century, the global average surface temperature has risen by 0.74 °C, although this increase has not been continuous. The linear warming trend over the past 50 years (0.13 °C per decade) is nearly twice that for the past 100 years’. Nevertheless, there are indications that over the past decade the global temperature rise has slowed down [9].
The Intergovernmental Panel of Climate Change (IPCC) consider that ‘there is high agreement and much evidence that with current climate change mitigation policies and related sustainable development practices, global greenhouse gas emissions will continue to grow over the next few decades’. According to all of its scenarios, the IPCC projects that the rise in temperature over the 21st century will very likely be larger than the rise over the 20th century [10].
Energy
Energy dependency
EU-27 energy dependency has risen steeply since 2000 and the level of around 55 % in 2008 is significantly higher than during the 1990s
More than half of EU energy is imported
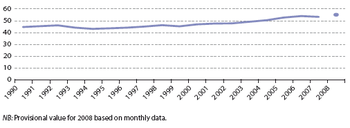
Energy dependency shows the extent to which an economy relies upon imports in order to meet its energy needs. Despite annual fluctuations, EU-27 dependency on imported energy remained rather constant throughout the 1990s, at a level of around 45 %. Since 2000, however, the level of dependency has grown, exceeding 50 % in 2004 and reaching a level of about 55 % (based on provisional data) in 2008. This represents a degree of dependence 10 percentage points higher than the average of the previous decade.
Apart from the growing demand for energy, the larger share of natural gas which is imported from outside the European Union and declining oil reserves in the North Sea have contributed to this development.
Gross inland energy consumption
The EU’s energy demand has grown moderately. Between 2000 and 2007 EU-27 energy consumption grew faster than in the previous decade, although since 2003 it has levelled off. There has been a general shift away from solid fuels towards natural gas and to some extent renewable energies.
Energy consumption has grown since 2000 but has shown signs of stabilising over recent years. An overall shift away from solid fuels towards natural gas and renewable energies has taken place.
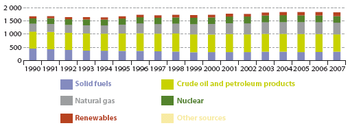
Gross inland energy consumption presented an average annual growth of 0.7 % between 2000 and 2007, slightly higher than the rate of 0.4 % in the previous decade. However, since 2003 energy consumption has levelled off . Overall, there has been a shift away from solid fuels, which represented about 27 % of the total consumption in 1990 and only about 18 % in 2007. This shift has been predominantly in favour of natural gas, rising from 18 % to 24 % over the same period, and, to a lesser extent, nuclear energy (rising from 12 % to 13 %) and renewable energies (rising from 4 % to 8 %). The share of crude oil and petroleum products decreased slightly from 38 % in 1990 to 36 % in 2007.
The rise in energy demand of about 80 million tonnes of oil equivalent between 2000 and 2007 mainly involved an increase of about 40 million tonnes of oil equivalent of both natural gas and renewable energies. While solid fuels also increased by about 10 million tonnes of oil equivalent, this was compensated by a decrease in crude oil and petroleum products, and nuclear energy.
Electricity generation from renewables
The share of renewables in electricity production increased from 13.8 % in 2000 to 15.6 % in 2007 in the EU-27, but remains below the path to the 2010 target of 21 %
Capacity of renewable electricity generation needs to speed up to meet 2010 target

Between 2000 and 2007, the contribution of electricity from biomass, hydro, wind, geothermal and solar energy increased progressively, reaching 15.6 % in 2007. After a decline during the early years of the decade, the annual growth rate is now substantially higher than during the 1990s. Between 2006 and 2007 the share of renewables grew by 1.0 percentage point. However, reaching the 21 % share by 2010 would require almost double of this rate.
Relatively long lead times for power generation investments may partially explain the previous slow progress. Prices for renewable energies, which for some technologies remain higher than conventional power generation, may also contribute to limit the speed of growth. In addition, regulatory barriers, such as difficulties in obtaining planning permission or grid access, persist in many Member States (see Commission communication Renewable energy road map. Renewable energies in the 21st century: Building a more sustainable future, COM(2006) 848).
Consumption of biofuels in transport
Biofuels are a small but rapidly growing energy source for transport. Their consumption has shown accelerated growth since 2000 and reached a share of 2.6 % in 2007 in EU-27. However, despite this growth their share remains below the target path
If growth in biofuels continues, the targets will probably be met

Between 1990 and 2000 the EU-27 share of biofuels in the petrol and diesel consumption of transport increased from zero to 0.24 %. From 2000 to 2007 the growth rate has increased leading to a share of 2.6 % in 2007.
Even though in 2007 the share of biofuels remains well below the target path, the current rate of growth would be sufficient to reach the 5.75 % target by 2010 as well as the binding 10 % target by 2020.
Combined heat and power
The uptake of combined heat and power, or cogeneration, has increased between 2004 and 2007, reaching 10.9 % of gross electricity generation in the EU-27
Combined heat and power generation has increased moderately since 2004

Despite the small decrease in 2006, the share of combined heat and power in total EU-27 electricity generation rose by 0.4 percentage points between 2004 and 2007 to 10.9 %. Although a longer time series for EU-15 is also shown in Graph 16, these data should be treated with caution due to changes in the calculation methodology over time.
According to the Energy Efficiency Action Plan, several barriers prevent expansion of capacity. These include the lack of district heating networks in many areas.
Implicit tax rate on energy
The implicit tax rate on energy fell by about 4 % between 2000 and 2007. Although this decrease in the effective tax burden on energy is inconsistent with the EU objective to shift taxation from labour onto resource and energy use, there are also indications that taxation may have stimulated energy saving
The implicit tax rate on energy has fallen since 2000

The ratio of energy tax revenues to final energy consumption represents the effective tax burden on energy. The decreases in the implicit tax rate show a decline in the effective tax burden on energy relative to the potentially taxable base. This is not consistent with the Sustainable Development Strategy’s principle of shifting taxation from labour onto resource and energy consumption. Nevertheless, there is some evidence that the previously high energy taxation has stimulated improvements in energy efficiency and has therefore helped to conserve energy. There has also been a greater reliance on policy instruments other than taxes, such as emissions trading. It is also true that energy taxes were reduced to compensate for the substantial rise in the oil price over recent years (see Taxation trends in the European Union, pp. 123-124).
Further Eurostat information
Publications
- Driving forces behind EU-27 greenhouse gas emissions over the decade 1999-2008 - Statistics in focus 10/2011
- Energy, transport and environment indicators - Pocketbook, 2009
- Panorama of energy: Energy statistics to support EU policies and solutions - Statistical book, 2009
- Sustainable development in the European Union - 2009 monitoring report of the EU sustainable development strategy
Database
- Indicators
- Climate Change and Energy
Dedicated section
Other information
- Commission communication, Promotion of the use of energy from renewable sources (Renewable Energy Directive), COM(2009) 28
- Commission communication, 20 20 by 2020: Europe’s climate change opportunity, COM(2008) 30
- Commission communication, An energy policy for Europe, COM(2007) 1
- Commission communication Energy efficiency: delivering the 20 % target, COM(2008) 772
- Commission Staff Working Document, The renewable energy progress report, SEC(2009) 503
- Green Paper - A European Strategy for Sustainable, Competitive and Secure Energy, European Commission, COM/2006/0105 final
- White paper - Adapting to climate change : towards a European framework for action, European Commission, COM/2009/0147 final
- Energy and environment report 2008, European Environment Agency, Report No 6/2008
- Greenhouse gas emission trends and projections in Europe 2008: Tracking progress towards Kyoto targets, European Environment Agency, Report No 5/2008
- International Energy Agency, World energy outlook 2009, IEA, Paris, 2009, in press
- Pachauri, R.K and Reisinger, A. (eds.), Climate Change 2007: Synthesis Report. Contribution of Working Groups I, II and III to the Fourth Assessment Report of the Intergovernmental Panel on Climate Change, IPCC, Geneva, 2007
- Rummukainen, M. and Källén, E., New climate science 2006-2009. A brief review of research into the physical science basis of the climate change issue since IPCC AR4/WG I of 2007, The Commission on Sustainable Development, Stockholm, 2009
- Stern, N.H., The economics of climate change: the Stern review, Cambridge University Press, Cambridge, 2007*Directive 2009/28/EC of 23 April 2009on the promotion of the use of energy from renewable sources(Renewable Energy Directive)
External links
See also
- All articles on sustainable development indicators
- Climate change statistics
- Energy production and imports
Notes
- ↑ See the indicator ‘energy intensity’ in the ‘socioeconomic development’ chapter
- ↑ See the indicator ‘greenhouse gas emissions by sector’ in this chapter.
- ↑ European Environment Agency, European Union greenhouse gas inventory 1990–2009 and inventory report 2011, Publications Office of the European Union, Luxembourg, 2011.
- ↑ International Energy Agency, Prospect of limiting the global increase in temperature to 2ºC is getting bleakerLatest information, 30 May 2011
- ↑ Eurostat news release, Euro-indicators 118/2011, Euro area and EU27 GDP up by 0.2%, 16 August 2011
- ↑ The Purchasing Power Standard (PPS) is an artificial reference currency unit that eliminates price level differences between countries. One PPS buys the same volume of goods and services in all countries. This unit allows meaningful volume comparisons of economic indicators across countries. Aggregates expressed in PPS are derived by dividing aggregates in current prices and national currency by the respective Purchasing Power Parity (PPP). The level of uncertainty associated with the basic price and national accounts data, and the methods used for compiling PPPs imply that differences between countries that have indexes within a close range should be interpreted with care
- ↑ The high level of GDP per capita in Luxembourg is partly due to the large share of cross-border workers in total employment. While contributing to GDP, they are not taken into consideration as part of the resident population which is used to calculate GDP per capita
- ↑ See the Structural Indicator ‘GDP per capita in PPS’ tsieb010on the Eurostat website.
- ↑ European Council, Review of the EU Sustainable Development Strategy (EU SDS) - Renewed Strategy, op. cit., p. 3): ‘... promote sustainable consumption andfckLRproduction to break the link between economic growth and environmental degradation’.
- ↑ Pachauri, R.K and Reisinger, A. (eds.), Climate Change 2007: Synthesis Report. Contribution of Working Groups I, II and III to the Fourth Assessment Report of the Intergovernmental Panel on Climate Change, IPCC, Geneva, 2007, pp.44-5.
