_to_population_change,_2010.png)
 to population change, 2010.png&body=Statistics Explained - Contribution of natural change and net migration (and statistical adjustment) to population change, 2010.png %0A https%3A%2F%2Fec.europa.eu%2Feurostat%2Fstatistics-explained%2Findex.php%3Ftitle%3DFile%3AContribution_of_natural_change_and_net_migration_%28and_statistical_adjustment%29_to_population_change%2C_2010.png)
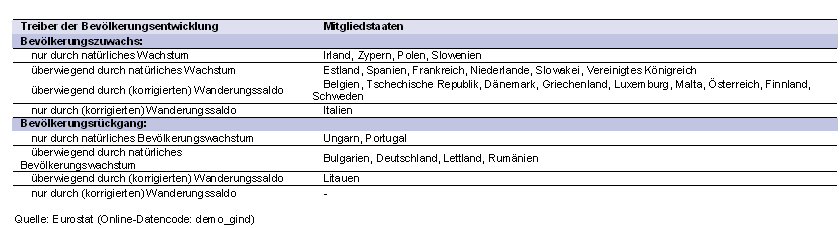
File:Contribution of natural change and net migration (and statistical adjustment) to population change, 2010.png
_to_population_change,_2010.png&diff=prev&oldid=67833)
_to_population_change,_2010.png&direction=prev&oldid=67833)
_to_population_change,_2010.png)
_to_population_change,_2010.png&diff=cur&oldid=67833)
_to_population_change,_2010.png&direction=next&oldid=67833)
_to_population_change,_2010.png&diff=next&oldid=67833)
Size of this preview: 800 × 217 pixels. Other resolution: 840 × 228 pixels.
Original file (840 × 228 pixels, file size: 14 KB, MIME type: image/png)
Contribution of natural change and net migration (and statistical adjustment) to population change
- 2010
Graph Map Table created with data from September 2011
Most recent data available now, see:
File usage
There are no pages that use this file.
_to_population_change,_2010.png&oldid=67833)
_to_population_change,_2010.png&action=edit&redlink=1)
_to_population_change,_2010.png&action=history)