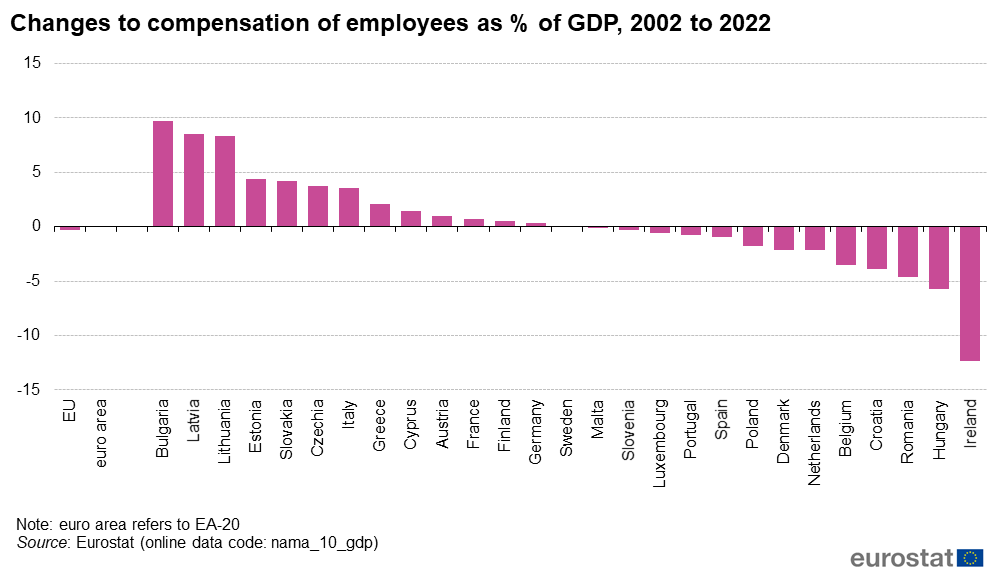
File:Fig3 Changes to compensation of employees as % of GDP, 2002 to 2022.png
Revision as of 11:48, 30 March 2023 by Andonti (talk | contribs) (Andonti uploaded a new version of File:Fig3 Changes to compensation of employees as % of GDP, 2002 to 2022.png)
Size of this preview: 800 × 460 pixels. Other resolutions: 320 × 184 pixels | 1,001 × 576 pixels.
Original file (1,001 × 576 pixels, file size: 43 KB, MIME type: image/png)
File usage
The following file is a duplicate of this file (more details):
There are no pages that use this file.