.png)
.png&body=Statistics Explained - Value of sold production by group of manufacturing activity, EU, 2011 and 2021 (% share of total sold production).png %0A https%3A%2F%2Fec.europa.eu%2Feurostat%2Fstatistics-explained%2Findex.php%3Ftitle%3DFile%3AValue_of_sold_production_by_group_of_manufacturing_activity%2C_EU%2C_2011_and_2021_%28%2525_share_of_total_sold_production%29.png)
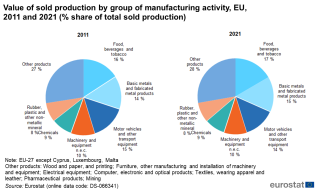
File:Value of sold production by group of manufacturing activity, EU, 2011 and 2021 (% share of total sold production).png
.png)
.png&diff=cur&oldid=573836)
.png&direction=next&oldid=573836)
.png&diff=next&oldid=573836)

Size of this preview: 800 × 477 pixels. Other resolutions: 320 × 191 pixels | 1,203 × 717 pixels.
Original file (1,203 × 717 pixels, file size: 238 KB, MIME type: image/png)
File usage
There are no pages that use this file.
.png&oldid=573836)
.png&action=edit&redlink=1)
.png&action=history)