.png)
.png&body=Statistics Explained - Table 1 - HICPs for selected cultural goods and services, rates of change, 2016-2021 (%).png %0A https%3A%2F%2Fec.europa.eu%2Feurostat%2Fstatistics-explained%2Findex.php%3Ftitle%3DFile%3ATable_1_-_HICPs_for_selected_cultural_goods_and_services%2C_rates_of_change%2C_2016-2021_%28%2525%29.png)
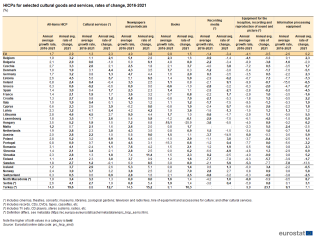
File:Table 1 - HICPs for selected cultural goods and services, rates of change, 2016-2021 (%).png
.png)
.png&diff=cur&oldid=560065)
.png&direction=next&oldid=560065)
.png&diff=next&oldid=560065)

Size of this preview: 792 × 600 pixels. Other resolutions: 317 × 240 pixels | 1,256 × 951 pixels.
Original file (1,256 × 951 pixels, file size: 121 KB, MIME type: image/png)
null
File usage
There are no pages that use this file.
.png&oldid=560065)
.png&action=edit&redlink=1)
.png&action=history)